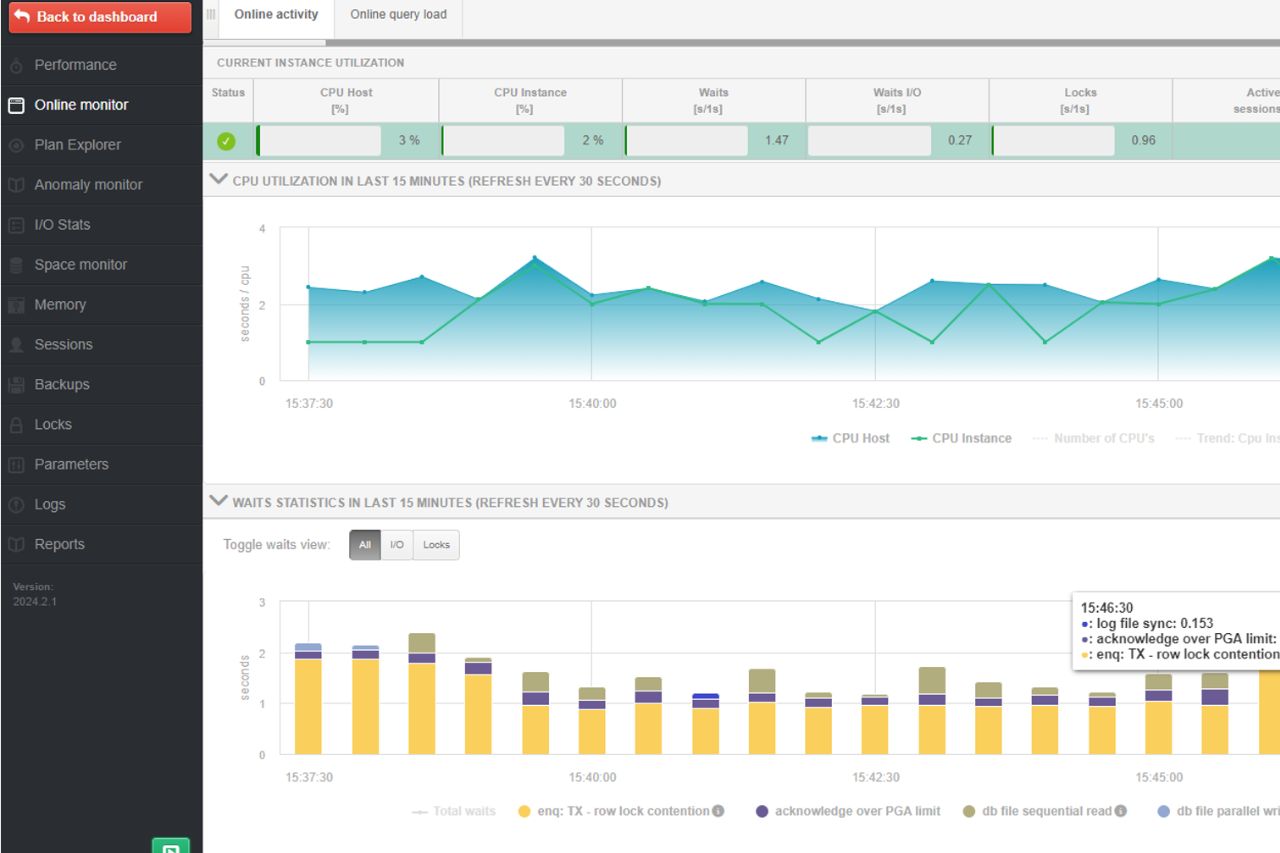
On December 31, 2020, we published a new version of Performance Monitor for Oracle, Microsoft SQL Server and PostgreSQL databases. The most important functions added in the application are: Anomaly monitor functionality modification, literals monitoring, procedure statistics, Object size Explorer
Anomaly monitor (Oracle, Sql Server)
The method of searching for performance problems in the monitored database has been modified in the latest version of the application. The primary change is to calculate the severity of performance problems found in the database. Thanks to this, the administrator can verify which problem is the most important for him. The division into problem classes will help you to easily determine which problems we deal most often with in a given database.
Additionally, we have added the ability to exclude individual queries from monitoring (useful for queries based on system views).
Literals monitoring (SQL Server)
In the latest version of the application, monitoring of query plans stored in the ProcedureCache memory buffer has been added. Monitoring available in the application allows you to check for which queries their execution plans take the most space in the buffer memory and how many versions a given query has.
The most common memory buffer shortage problem is when there are queries with literals in the SQL instance. This means that each time a query is run with a literal, a specific version of the plan is saved in the memory buffer.
Statistics for procedures (Oracle, SQL Server)
We have added monitoring of procedures run in the database. This information is available in the Instance Load tab in the Procedures tab at the SQL instance detail level.
The statistics visible in the application present data divided into 15-minute snaps. Statistics for procedures, just like the query itself, can be viewed on the SQL Details page.
Object size Explorer (PostgreSQL)
In the latest version, we have added the functionality of collecting information about the size and the number of rows in objects (e.g. tables, indexes) located in the monitored PostgreSQL instance. From now on, it will be possible to verify the space size by a given object over time. The data of objects size are collected at two-hour intervals and saved to the repository database.
Access to software updates
The DBPLUS software is updated at least 4 times a year. Customers have access to all updates when they have a license or maintenance service. With the upgrade to the latest version, the application will run faster and smoother. Each published version provides new functionalities that allow for easier management and performance improvement in the monitored database.
Detailed specification about changes in version 2020.4:
|
The user documentation describes in an accessible way all the new functions available in the software Oracle: Microsoft SQL Server PostgreSQL: |


