DBPLUS offers a unique solution for effective optimisation of Oracle and Microsoft SQL Server database performance. DBPLUS Performance Monitor software allows you to very precisely monitor database performance and search for bottlenecks which can be optimised. Apart from its advanced monitoring software, DBPLUS also offers a wide variety of services aimed at optimising database performance. DBPLUS Performance Monitor software and service were developed based on 15 years of experience of the DBPLUS team of experts in problem solving and database environment optimisation.
Thanks to the use of custom-designed DBPLUS Performance Monitor software and the many years of experience of our DBPLUS engineers, business applications using databases can increase the operational speed by many times over without the need to buy new servers.
The service covers:
- Analysis of database performance issues including those defined as critical
- Searching for bottlenecks and SQL queries which can be optimised
- Achievement of a guaranteed optimisation level for each database as defined by DBPLUS
- Implementation of changes at the database level without interference in the application code
- Before and after benchmarking and performance results testing
- Recommendations and best practices for maintaining the current performance level addressed to database administrators
Watch a short introductory video
The amount of information that a companies use in their everyday operations is growing very quickly. Systems and applications can’t always keep up in terms of performance. Problems with the effective operation of IT systems often impact clients and can have an effect on business results. This can be due to slow operation of a web shop or a B2B ordering system. As much as 90% of problems associated with slow system operation result from improper database operation.
DBPLUS optimises database algorithms, making them work significantly better. What’s more, thanks to database optimisation, IT expenses on alternative methods of increasing system efficiency can be significantly limited.
Overview
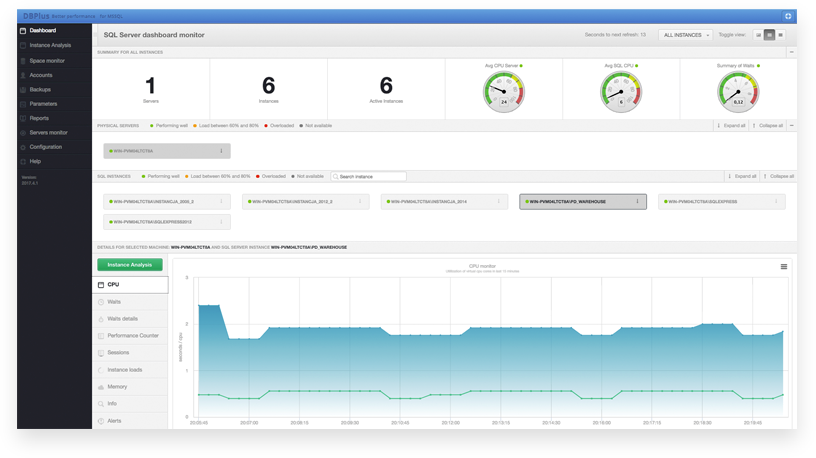
- By using the “Database load” function, it is possible to quickly check the server load generated by the processes of a database for a given period.
- The application provides fast access to metrics such as CPU usage, wait times of all sessions, total usage on the server where the database is located, and number of CPUs available on the server.
- Access to data makes it possible to quickly identify outliers from the trend. Thanks to the possibility to adjust the scale, it is possible to increase the precision of selected points. Data are saved every 15 minutes.
- For each point, a list of all queries executed is available. Using the SQL Details tabs, it is possible to obtain access to performance statistics for every query which was executed in the database. This makes it possible to browse the performance of specific queries and all plans of their execution.
- The Load Trends function checks trends in the database over a long period, making it possible to monitor wait times for all queries in the database for every 15-minute period, hour, day, week, or month.
- SQL Analyze makes it possible to analyse the individual query load compared with all database queries to identify those queries which may require optimisation.
Solving database performance with DBPLUS Performance Monitor
Our philosophy
We focus on tuning individual SQL queries instead of changing global database parameters. Below you will see why this is so important.
Other companies |
DBPLUS |
|
| Focus on attempts to modify global database parameters in order to accelerate their operation. |  |
DBPLUS is focussed on individual SQL queries which cause efficiency problems. |
| Users work with an application which sends queries to the database. |  |
Users work with an application which sends queries to the database. |
| Certain queries have a negative effect on the database and cause considerable slowdown in their operations. |  |
Certain queries have a negative effect on the database and cause considerable slowdown in their operations. |
| An attempt to modify several database parameters in order to improve efficiency. |  |
Precise searching of SQL queries that are bottlenecks of the system and modification only of performance parameters and algorithms of such problematic queries. |
 |
 |
|
| The result of such modification is unknown; very often changing the general parameters has a positive effect on some queries, but negative on others, and does not generally increase database efficiency. |  |
Change only of performance parameters and algorithms of such SQL queries that are bottlenecks in the database gives a 100% guarantee of a positive effect on the database’s efficiency. It does not have a negative effect on other areas. |
 |
 |
|
| General acceleration of a database is very difficult to achieve with this method. | This method guarantees acceleration of database operations. |
The way we work
DBPLUS
There are matters that we must work on ourselves with our software. Therefore, please do not be offended if we say that we’ll get back to you in a few days.
You – our Client
There are matters that we need to work on together with you. Since you are the one who knows your business well, your opinions and suggestions are particularly valuable to us.

1. Installation of software
First of all: we install DBPLUS PERFORMANCE MONITOR over a period of up to 20 working days. In this manner we gather necessary information about the efficiency of your systems and databases.
2. Analysis of problems related to performance efficiency
Secondly: we conduct an analysis of efficiency problems for the processes defined as critical by the Client.
3. Determining the level of optimisation
The next step is to define the level of database optimisation that we can guarantee, to what level the resource usage will be reduced, and to what extent the optimised processes will accelerate their operations.

4. Preparing changes for implementation
We prepare the changes to be introduced in order to increase the efficiency of one or more indicated processes in the database. These changes will be implemented from the level of the database without interference in the application code.

5. Implementation of changes
After obtaining your agreement, we implement changes in the database. Making use of our software, DBPLUS Performance Monitor, we measure the results and compare them with previously measured values of process efficiency.
FAQ
1. Do you perform services remotely or locally?
Performance on demand service depends on Client needs, is performed remotely or locally in the place indicated by the Client. Performance management service is performed only in the remotely way by the DBPLUS Monitoring Center. In this way, we are able to provide constant performance for the duration of the contract.
2. What is needed to use DBPLUS service?
Each service requires prior installation of the Performance Monitor software. Performance information are collected from the moment of monitoring. To best service perform, we recommend minimum a few days of operation of the application on a monitored database and only after that time we begin to perform services.
3. How Performance on demand works?
Performance on demand includes:
1. preparation of a statement that contain information about basic performance measures such as Elapsed Time of queries, CPU utilization or statistics of readings from disk devices. As part of the analysis, DBPLUS administrators set the percentage level of optimization that can be achieved by following the recommendations prepared by DBPLUS,
2. in the second stage, we prepare detailed report that contain necessary changes that will improve the database’s performance. The report contains a detailed analysis of top queries with a recommendation to improve their performance that can be achieved without interfering with the application code. The report also contains information about bottlenecks and how to remove them (e.g. high level of locks),
3. after implement the recommendations, the client receives a final report that shows results of the implemented changes. Comparison of database performance before and after implementation of the recommendation.
4. You really do not charge any fees if you fail to deliver performance improvements at a promised level?
Absolutely yes! Our philosophy of operation assumes that the services offered to our clients are ALWAYS financially beneficial for them, no matter how many hours we work on the solution. We charge only when we provide an agreed level of performance improvement. In this way, cooperation with DBPLUS is 100% risk-free.
5. How do I know which services I need: Performance on Demand or Performance Management?
Performance on Demand is the best option for systems that have lost productivity after some time but are not constantly evolving. When your system is constantly changing to implement new functionality and keep pace with the ever-changing business environment, Performance Management is the better choice as performance improvements once implemented may not work well after future system updates.
6. How do you know how much you can improve database performance?
DBPLUS Performance Monitor gives us very precise information about the execution times of each single SQL query in the database along with information about the CPU occupancy and the amount of data exchanged on I/O operations. Thanks to the extensive experience of our experts, based on information from Monitor, we can predict with great certainty how much improvement can be made in database performance. The accuracy of our estimation is so great that we are not afraid to give our famous guarantee to our customers “No success – No charge”.