In the complex ecosystem of SQL Server, performance issues can sometimes feel like detective work, especially when tracking down the elusive culprits behind system locks. This time, we’re exploring how ineffective queries (and poorly executed query monitoring) can grind operations to a halt, and how to identify the “how” and “why” behind the halt.
From scrutinizing load trends to dissecting lock histories and refining execution plans, we’re making sure that no stone—or should we say, no data block—remains unturned in our quest to keep SQL Server zipping along like a sports car rather than trudging like a pack mule.
Load Trends and CPU Usage
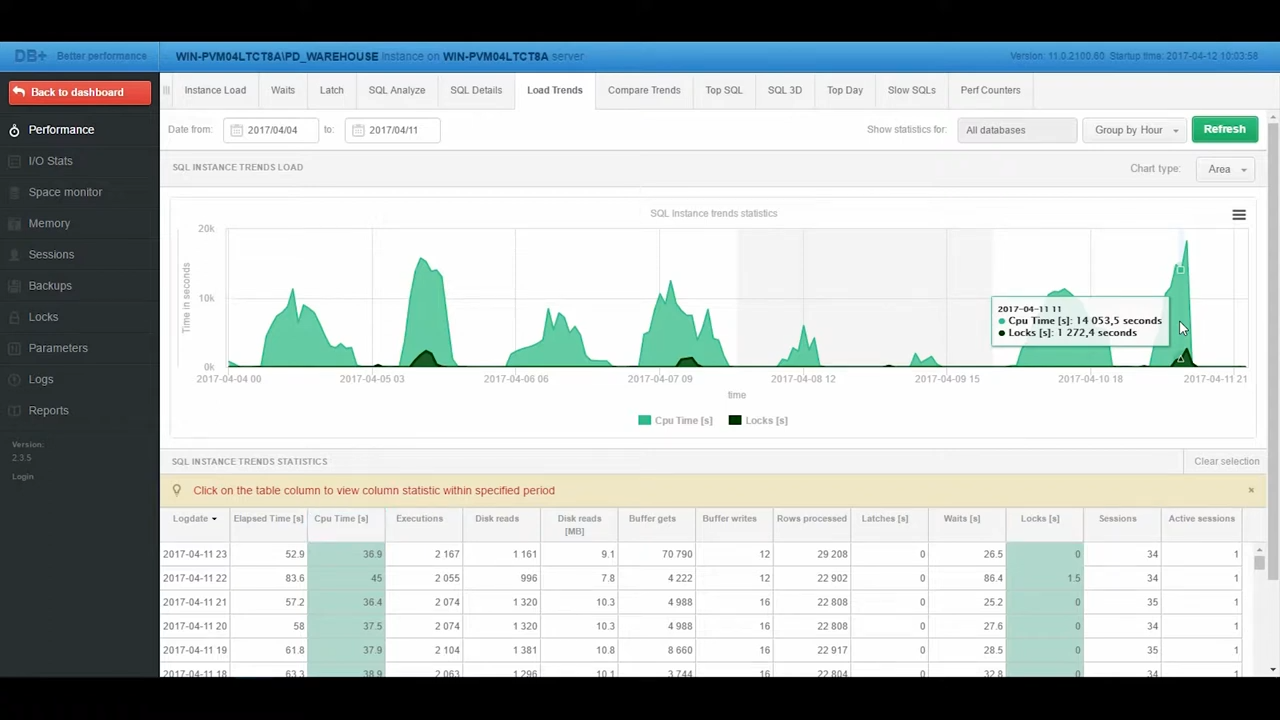
The Load Trends screen offers a heaven for query monitoring SQL detectives. It’s a close look at performance statistics for SQL Server instance queries. By grouping statistics by hours from April 4th to April 11th, we initially focus on CPU usage impacted by running queries. Here is the drama—significant locking incidents were noted on:
- On April 5th, the CPU decided to throw a bit of a tantrum, causing a ruckus with significant locking incidents.
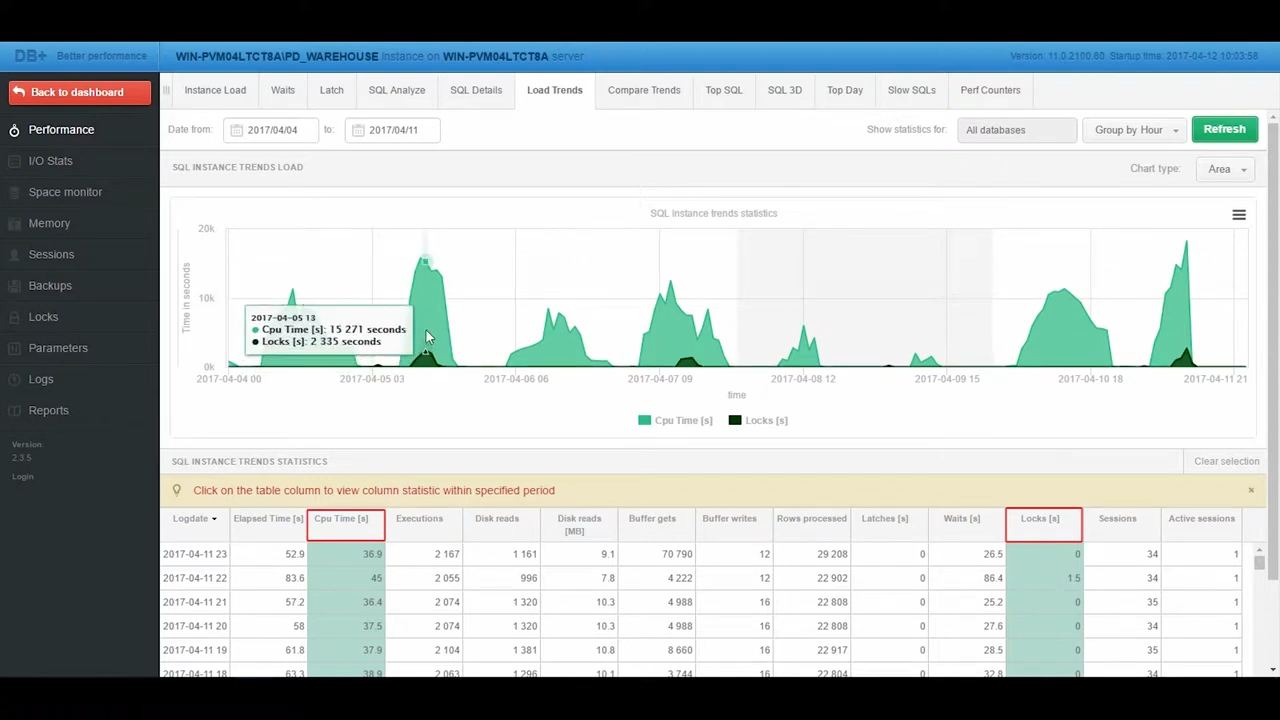
- April 7th and the notorious 11th joined the fray, with the 11th really going for it—locking up resources for a staggering 1 272 seconds.
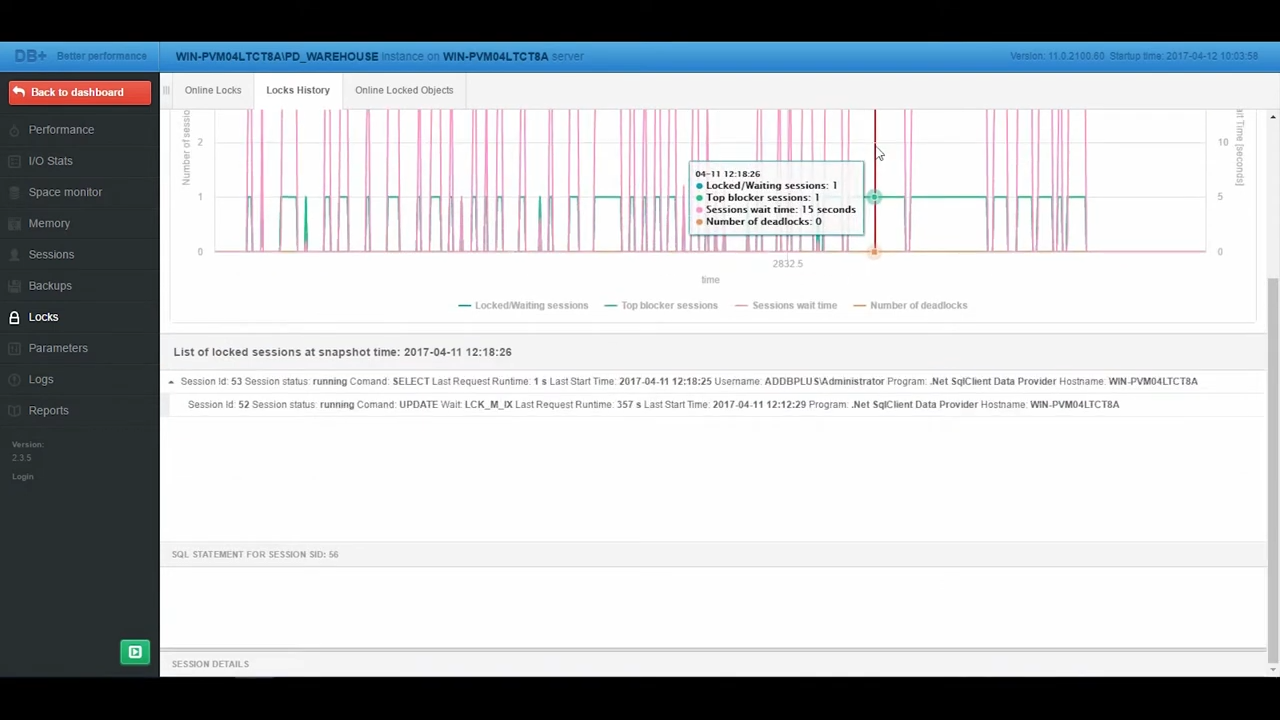
Lock History and Session Analysis
Venturing further into the heart of the matter, the Lock History tab serves as our time machine to past lock skirmishes. Here, each lock type from particular days gets its moment under the microscope. A lively interactive graph charts the ebbs and flows of database drama. It shows us the number of blocking and waiting sessions along with how long they’ve been at it.
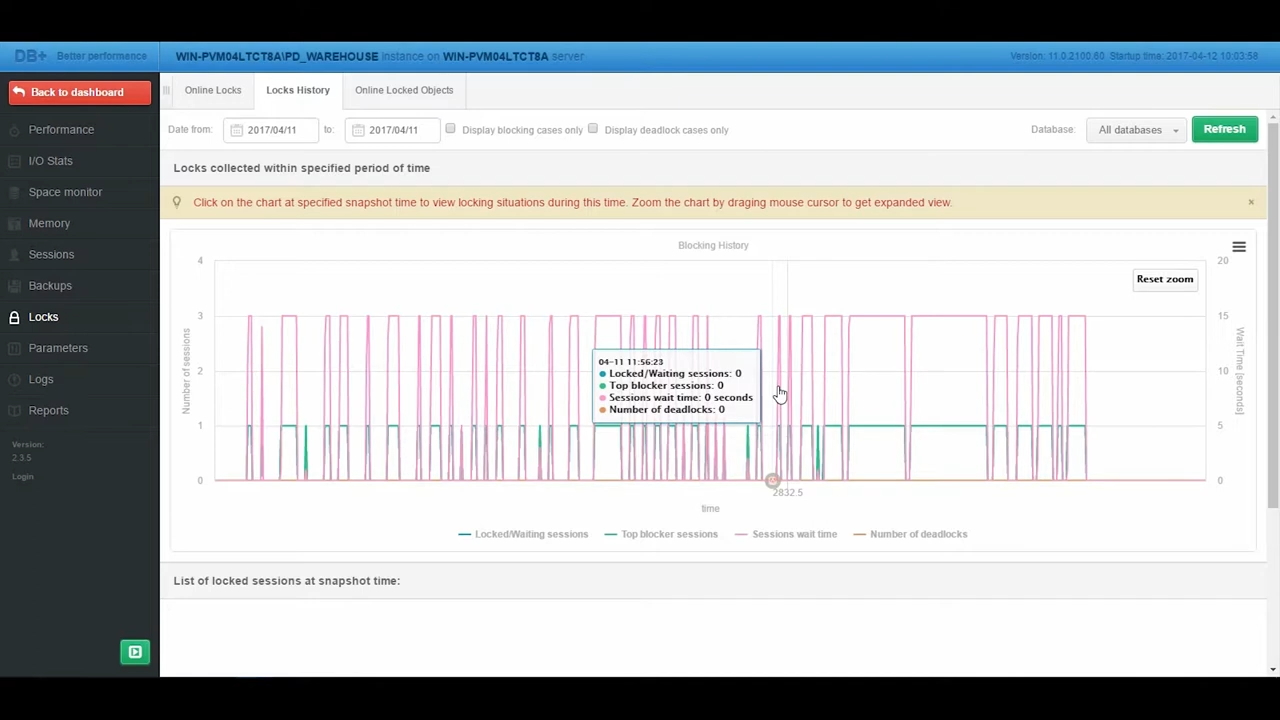
A simple click on the graph reveals the culprits behind each lock. It separates the instigators (locking sessions) from the victims (waiting sessions).
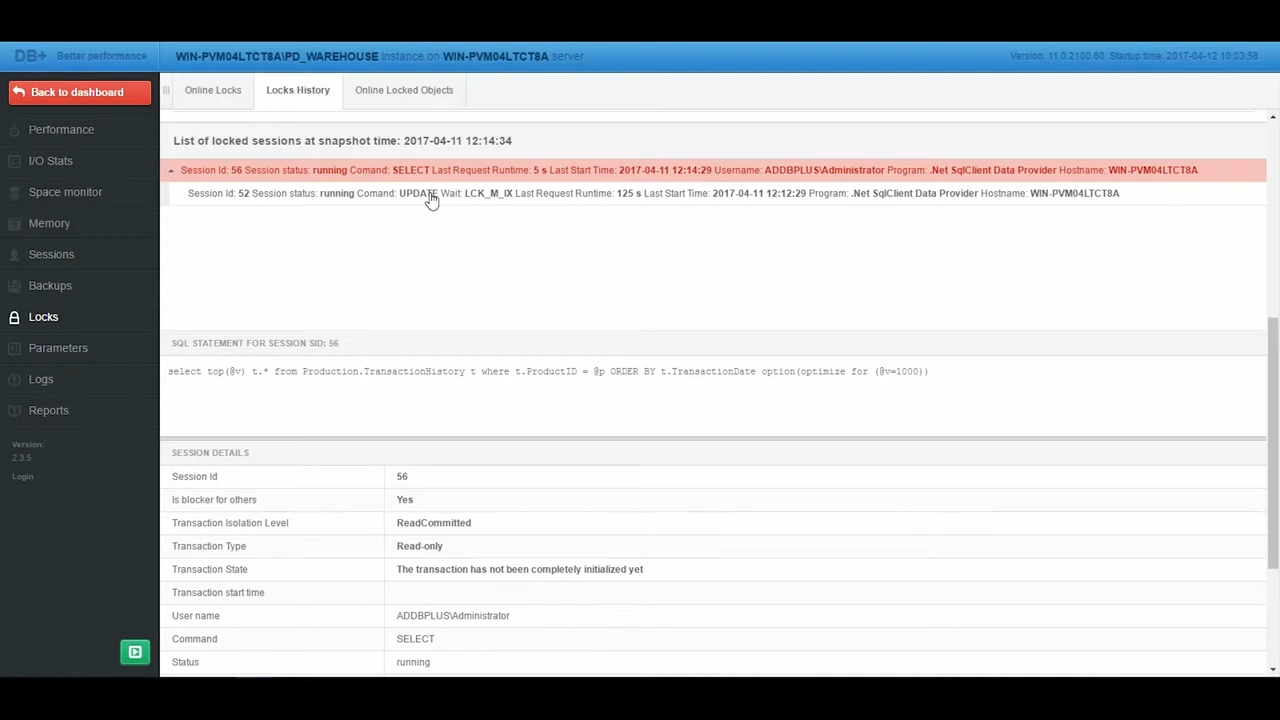
What’s intriguing is that our investigation uncovered a repeat offender. The same session, sporting different numbers, was caught red-handed, consistently executing the query that triggered the locks. Quite the plot twist!
Query Statistics and Execution Plans
Visiting the SQL details screen we can track the query’s antics from April 11th to 20th, discovering it’s a bit of a performance chameleon. On the 11th of April, it decided to try out an execution plan that, frankly, dawdled at a leisurely 2.7 seconds per run. This plodding pace was quite the show compared to its subsequent performances.
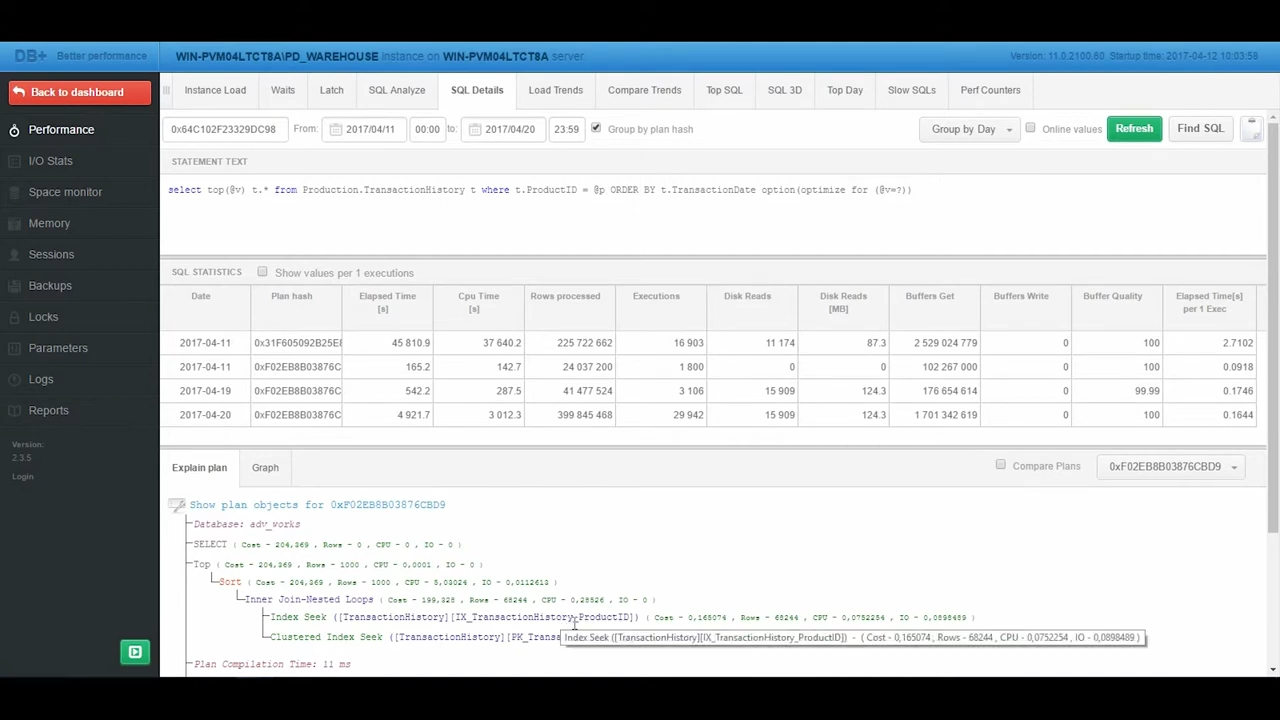
On brighter days, our query opted for a sprightlier execution plan. It zipped through data at a rate five times swifter than its earlier sluggish self. This change of pace not only shows a query can change its stripes. It also highlights the dramatic impact of picking the right plan.
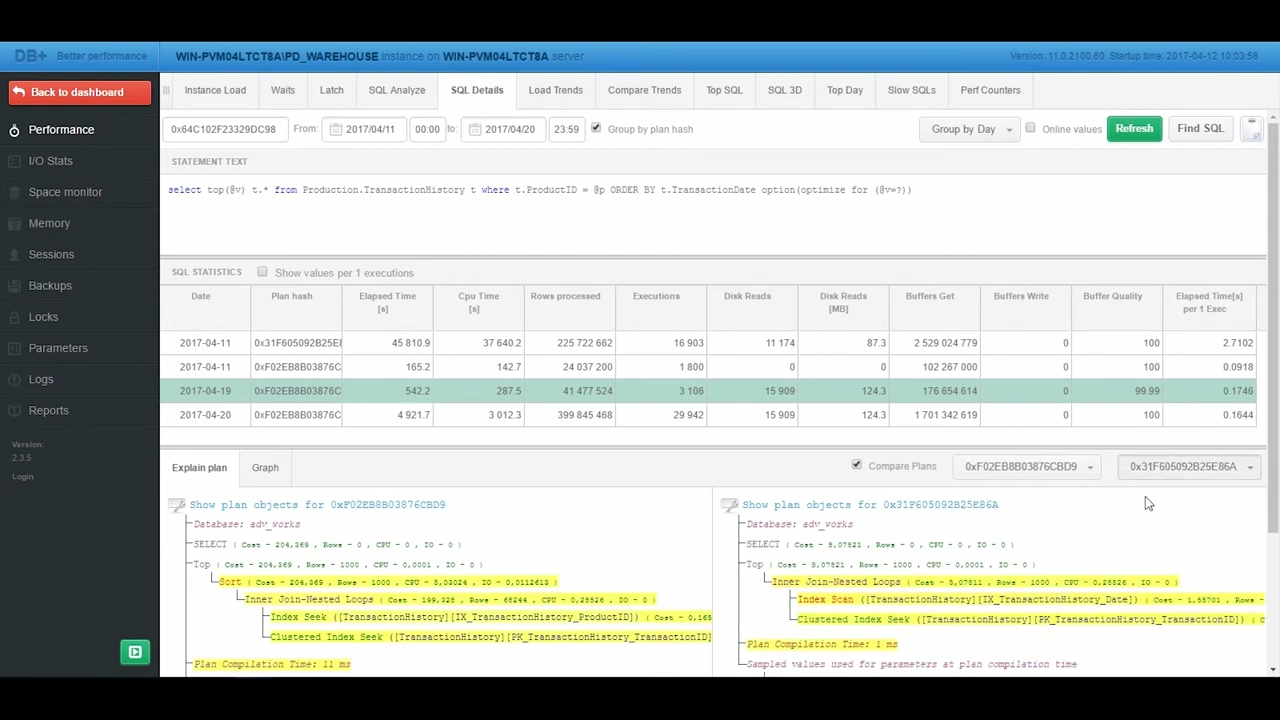
Optimizing Performance with Strategic Indexing
Comparing the two execution plans highlighted a significant recommendation: adding an index to the Product ID column. This tweak turned out to be a masterstroke, supercharging the query’s speed and sweeping away those pesky locking issues. It was a classic case of strategic indexing flexing its muscles to enhance SQL Server performance.
This episode underscores the importance of vigilant monitoring and timely tweaks—hallmarks of the DB Plus Performance Monitor. Such tools are indispensable for sniffing out and fixing performance bottlenecks, ensuring the SQL Server runs like a well-oiled machine.