Initial Situation
Let’s take a look at the load time on the 20th of April. Right away, we notice that while the query load time typically varies between 12 and 15 seconds per snapshot, there is a notable spike to over 2,000 seconds per snapshot during certain periods.
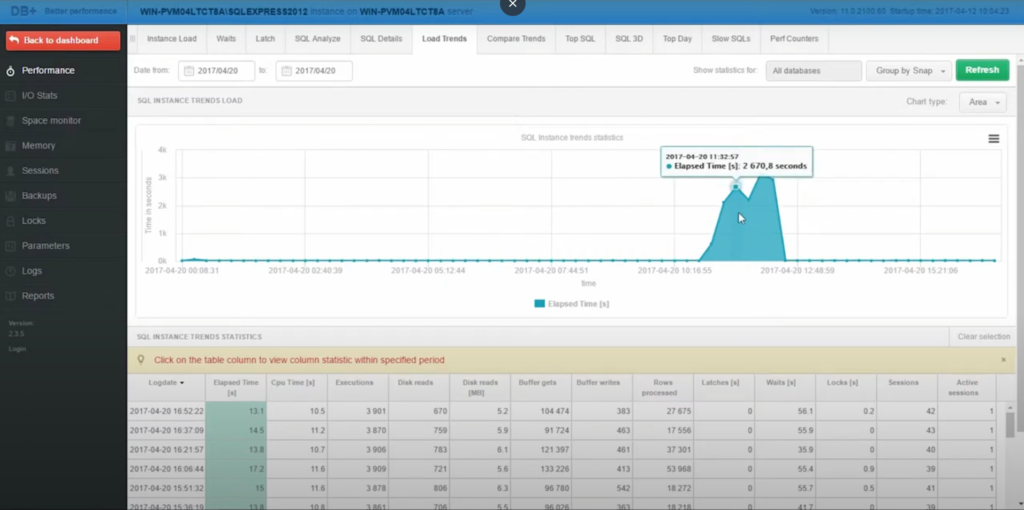
Such an anomaly could severely impact the overall performance of the database. The extended duration of query processing suggested that the system was indicative of a deeper, possibly systemic issue. This initial discovery called for a more detailed examination into the causes of these delays, guiding the troubleshooting process towards specific performance bottlenecks.
On the Way to Identify the Problem
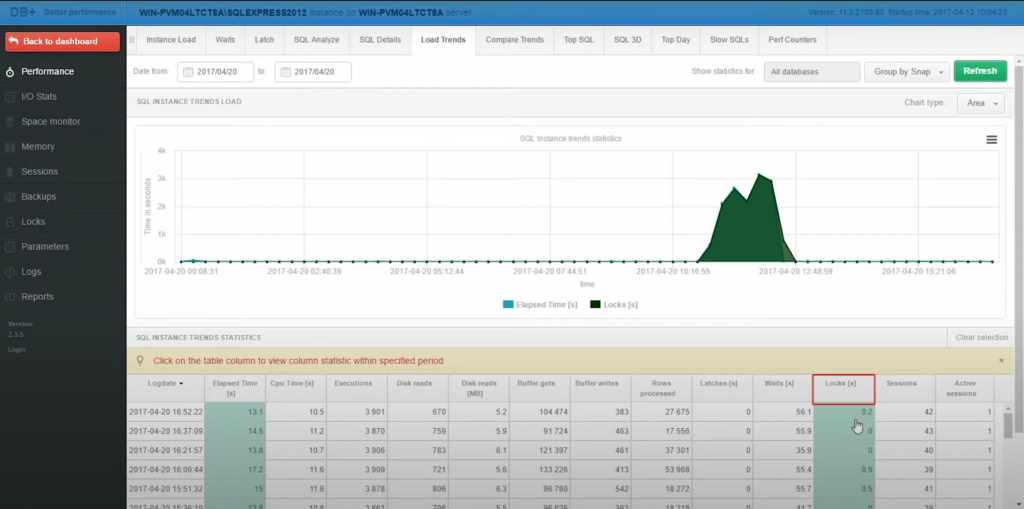
With the anomalies identified, the next logical step was to look for a possible correlation of locks by application issues with executions, disc reads, buffer writes, and so on. But only after examining the lock statistics, a pattern is clear—there is a significant overlap between the moments when query durations increase and when locking issues intensify.
Detailed Lock Analysis
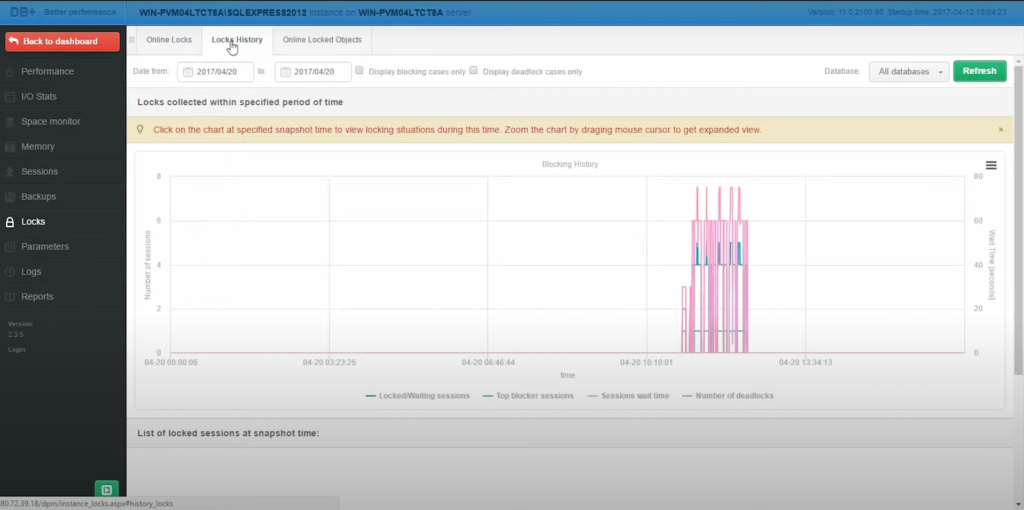
To begin a thorough analysis, we are heading to the lock history tab, which records all lock events on a specific day. This section is meant to provide us with a chronology of events. We click on individual points within the timeline to access comprehensive data about each lock event.
How we’re going to go about analyzing the Day’s Lock Events:
- Accessing Detailed Information: By selecting a particular point on the timeline, we are presented with more details regarding each lock event. This includes the time the lock occurred, its duration, and the specific elements of the database it affected.
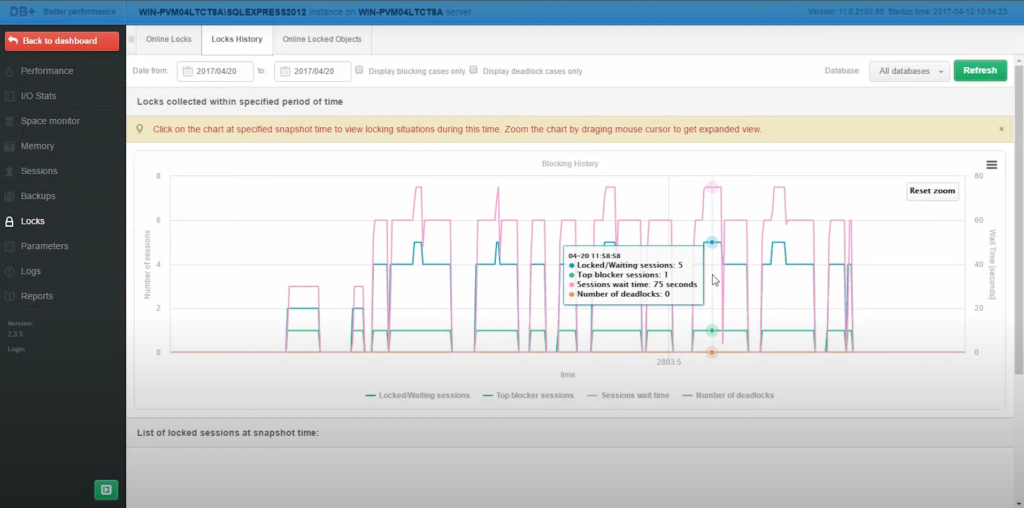
- Examination of Locked and Waiting Sessions: The highlights are not only the sessions that are actively holding locks but also on those that are in a waiting state due to these locks. For each session, we see a display of critical data such as session ID, status (active, waiting, sleeping), and the exact start time of the transaction.
- Analysis of Wait Times: An essential feature of the lock history tab is its ability to show the duration for which sessions have been waiting due to locks by application issues. This is particularly useful for identifying sessions that are causing significant delays, providing clear targets for further investigation or immediate action.
Session Analysis
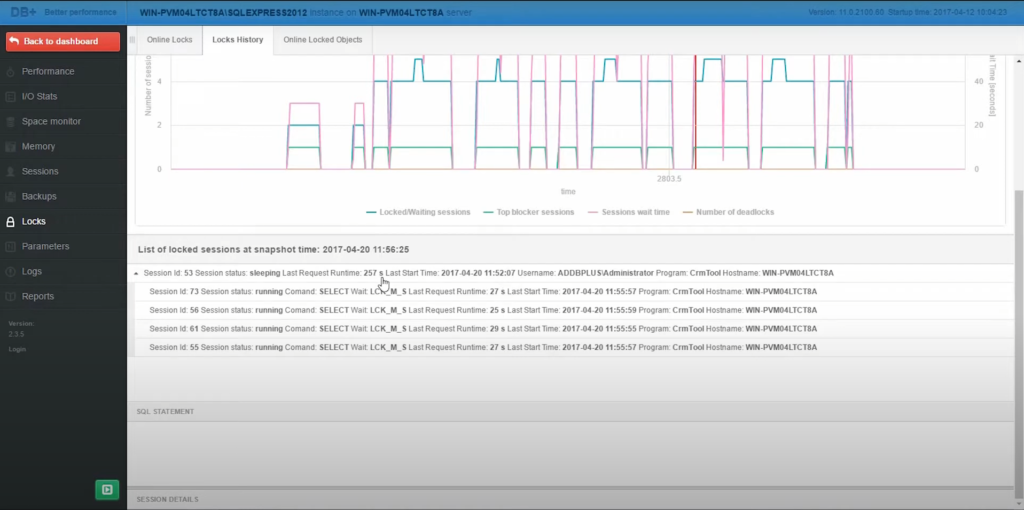
The session in question was consistently marked as ‘sleeping’ across multiple snapshots. This status indicates that while the session was connected and a transaction was initiated, no active queries were being executed for extended periods. The session began a transaction at 11:55 AM but showed no activity for 257 seconds in the initial observation. Subsequent snapshots indicated that this inactivity continued, with the session still failing to execute any queries. This prolonged inactivity held up resources while also blocking other transactions, leading to increased wait times for other sessions.
Root Cause Analysis
The analysis reveals that the user application did not adequately manage its transactions. The sleeping state of the transaction indicated that it was initiated but not actively processed either due to a lack of queries being executed or the absence of transaction finalization commands like commit or rollback. This improper transaction management suggests that the application might lack robust error handling or transaction timeout policies that could preemptively avoid prolonged inactivity.
System Impact
Improper transaction handling can lead to several issues within a database environment, primarily through the creation of unreleased locks. In the case in question, the application’s failure to properly manage transaction states resulted in unnecessary Locks by application on resources that were not in active use. This caused the blocking of other transactions and degrading overall system performance. This situation was exacerbated during peak load times, when the compounding effect of multiple inefficient transactions slowed down operations.
Strategies for Mitigation
There’s a lot to be done in order to prevent such situations in the future:
- Implement Query Optimization: Review and optimize slow-running queries. Use indexing strategies and optimize SQL queries to reduce execution time and resource locking.
- Adjust Lock Timeout Settings: Set appropriate timeout settings for transactions to prevent long wait times. This can help in automatically terminating transactions that are causing locks if they exceed a certain time threshold.
- Introduce Load Balancing: Distribute database load across multiple servers or instances. This will help mitigate the impact of heavy queries and reduce the occurrence of locks during peak times.
- Concurrency Control Mechanisms: Implement advanced concurrency control mechanisms. Solutions such as optimistic concurrency or row versioning help manage data consistency without heavy locking.
- Regular Performance Monitoring: Utilize tools like DBPLUS PERFORMANCE MONITOR more frequently. They are indispensable to identify performance bottlenecks early and take proactive measures before they affect system performance.