Accessing crucial data, optimizing information retrieval, and securing data access are the key factors in ensuring the flow of information on the road to operational success.
How do DevOps professionals go through the data to find the insights that matter? What tools and strategies can make the process of information retrieval easier without compromising on security? In a world where data breaches are all too common, how can teams ensure their data access remains secure, yet unfettered, to maintain operational efficiency? In the following sections, we will answer these, and many other questions.
Access to the Right Information
The first factor that matters for a DevOps operator is the ability to skilfully paddle through a deluge of data to pinpoint insights that can be a getaway to improvement.
– What data do we normally focus on?
Relevant data spans application-generated logs, custom Key Performance Indicators (KPIs), and graphical representations crafted using advanced tools like Grafana. The diversity and volume of this data are immense, presenting a significant challenge in identifying the most relevant information necessary for effective decision-making.
The Challenge of Finding What Matters
The issue compounds when considering the dynamic nature of DevOps environments. Here, data streams are continuous, and the landscape evolves rapidly. This constant flux means that what was relevant yesterday might not hold the same value today. What’s more, new data points can emerge as critical indicators of system health or performance bottlenecks.
Moreover, the scattered nature of these data sources adds another layer of complexity. Logs might be distributed across various systems. KPIs could be defined in disparate monitoring tools, and graphical data might reside in different dashboards or platforms. This dispersion forces DevOps teams to spend considerable time just gathering data, before even beginning the actual analysis.
Another challenge is the potential for data gaps. In the rush to address immediate operational issues, someone may overwrite logs or not capture metrics. This leads to blind spots in understanding system behavior over time. The gaps can hinder the ability to perform root cause analysis or to predict future system performance issues effectively.
How DBPLUS PERFORMANCE MONITOR Steps Up
- Infinite Data Retention for Historical Analysis: DBPLUS PERFORMANCE MONITOR maintains a comprehensive database of historical metrics. By doing so, it allows for a retrospective examination that can inform future optimizations and troubleshooting efforts. No valuable insight ever gets lost because of time constraints.
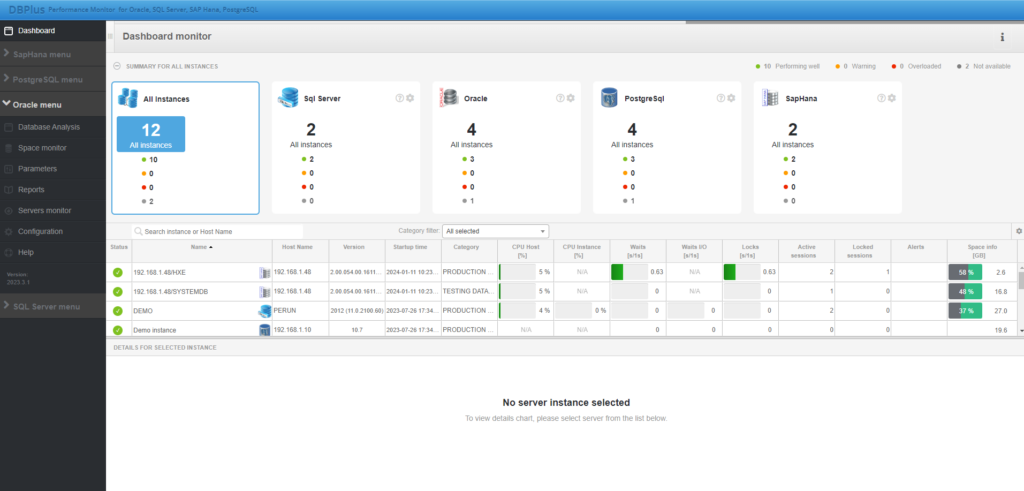
- User-friendly Dashboard: The dashboard cuts through the noise, presenting essential information in a digestible format. This aspect of DBPLUS PERFORMANCE MONITOR is vital for rapid diagnosis and response, allowing users to instantly assess the health of their databases at a glance.

- Ergonomic Data Presentation for Oracle Systems: Specializing in Oracle systems, DBPLUS PERFORMANCE MONITOR leverages extensive experience. What for? – To tailor its data presentation specifically to the nuances and requirements of these environments. The ergonomic design ensures that information is not only accurate but also presented in a certain way. This way aligns with the operational workflows and analytical needs of Oracle database administrators.
Efficiency in Information Retrieval
Response times are the benchmarks that can make or break the operational efficiency of an entire system. Lengthy response times delay problem resolution. However, they also compound the issue by affecting end-user experience and potentially leading to significant downtimes. The ripple effect of these delays can disrupt the balanced ecosystem of services and operations that DevOps teams scrupulously maintain.
How DBPLUS PERFORMANCE MONITOR Can Help?
- Ability to Manage Hundreds of Databases and User Queries Simultaneously: One of the standout features of DBPLUS PERFORMANCE MONITOR is its ability to scale and manage a vast array of databases and user queries without breaking a sweat. This capability ensures that as the volume of data and the number of databases grow, the system remains unfazed, delivering the same level of performance and responsiveness.
- Designed for a minimal footprint: The system is designed to provide zero-load insights into database performance issues. By minimizing consumption of monitored databases and ensuring that data collection processes are efficient and non-intrusive, DBPLUS PERFORMANCE MONITOR ensures that performance information is up to date. This allows you to analyze and respond to potential bad changes without any noticeable impact on the monitored database or application. DBPLUS PM does not use local programs (agents) for collection, which significantly affects the costs and security of maintaining this product.
Historical Data Contextualization
Understanding the historical trajectory of system performance, configuration changes, and the impact of updates or network adjustments is what historical data contextualization is all about. It’s about piecing together the story of your infrastructure’s evolution. Its goal is to identify when and why performance peaks and troughs occurred, and how various changes have influenced the system’s efficiency and reliability.

How DBPLUS PERFORMANCE MONITOR Takes Historical Data Analysis to a New Level
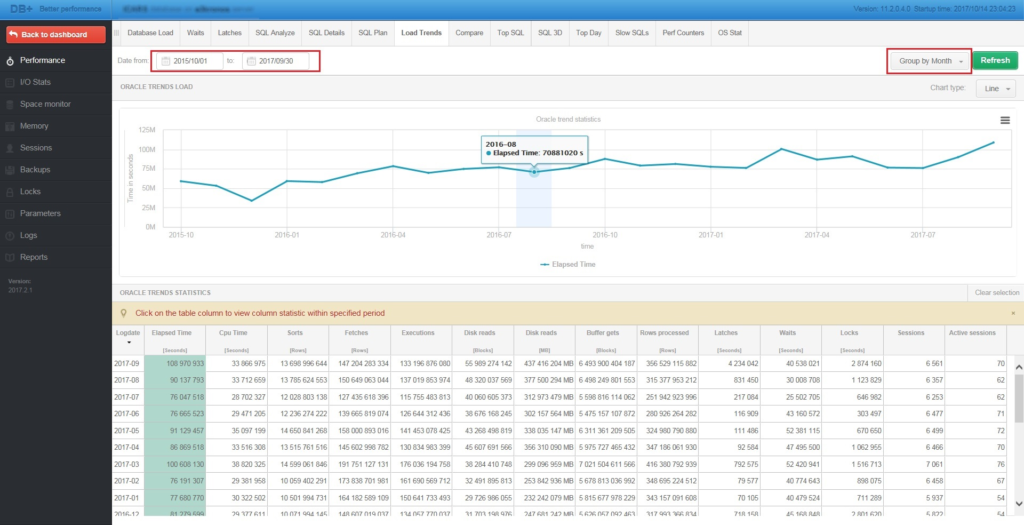
- Long-Term Trend Analysis: By capturing an infinite timeline of data, DBPLUS PERFORMANCE MONITOR allows teams to trace the lineage of system performance. There’s simply no other way to uncover patterns and anomalies that span years.
- Graphical Representation of System Components: The software transforms complex datasets into intuitive graphical representations.
- Enhancing DevOps Understanding and Management: By contextualizing historical data and rendering it through user-friendly visuals, DBPLUS PERFORMANCE MONITOR significantly improves the depth of understanding and management capabilities of DevOps specialists.
Security in Data Access
At the heart of this domain is the dual need to ensure quick and undisrupted access to critical system data for performance monitoring and tuning, while simultaneously guarding this data against unauthorized access or breaches.
Enhancing Security in DBPLUS PERFORMANCE MONITOR:
- Integration with Active Directory: DBPLUS PERFORMANCE MONITOR ensures that only authorized users can access the system. This integration is fundamental in securing a perimeter around the tool, controlling metric access through a familiar and trusted framework. It enables precise management of user permissions, ensuring that individuals access only the data and functionalities pertinent to their roles. It minimizes the risk of internal threats and data breaches.
- Automatic Logout to Prevent Unauthorized Access: Recognizing the potential risks of idle sessions, DBPLUS PERFORMANCE MONITOR automatically logs out users after a period of inactivity. This proactive security measure significantly reduces the vulnerability of the system to unauthorized access. It’s thus acting as an automatic safeguard against potential security lapses that could occur if a user’s session was left unattended.
- Principle of Least Privilege in Data Access: In adherence to best security practices, DBPLUS PERFORMANCE MONITOR is designed to ensure that monitoring activities are confined to system metadata, excluding direct access to user data. This distinction is crucial for maintaining user privacy and data protection, emphasizing the tool’s role in performance monitoring without overstepping into the realm of sensitive data handling.
- Encrypted Data Exchange: Security in data access extends beyond the boundaries of the monitoring tool itself to encompass the integrity of data in transit. DBPLUS PERFORMANCE MONITOR employs encryption in its data exchanges with databases, safeguarding the data from interception or tampering. In the case of Oracle, we use Oracle Database Native Network Encryption.


