A state-of-the-art system for monitoring and analysis of database performance.
All-inclusive and easy-to-use intuitive software which shows database performance problems in a clear way, yet is also able to precisely indicate their causes. One of the main issues in effectively providing IT services is maintenance of adequate performance levels of the system.
Frequently, the only solution that many companies can offer to these problems is investment in larger, more efficient servers. Unfortunately, this does not always bring the anticipated results despite high expenditures. Optimisation of business system performance on the level of existing databases can be an effective solution to these problems.
Instead of investing in hardware, performance problems can be more effectively solved by using the appropriate database optimisation at the level of the most overloaded SQL queries. To optimise a database, it is essential to locate bottlenecks and understand why they arise.
Key features:
- Rapid analysis of performance trends thanks to collected history of database metrics
- Minimal DB engine load from monitoring tools
- Users do not have access to business data in monitored databases
- Intuitive interface and simple navigation for business systems administrators
- Systematic updates and adaptation to the client’s needs
Watch a short introductory video
Familiarise yourself with the main application screen and configuration possibilities of the dashboard, as well as how to access basic and advanced parameters of the monitored databases. Thanks to its intuitive design, DBPLUS Performance Monitor™ can be used not only by database administrators but also by other IT specialists, such as application developers or administrators, making cooperation within the organisation easier and accelerating problem solving.
The application architecture makes use of an IIS server to allow many users access to the app via an Internet browser. This significantly accelerates implementation of DBPLUS Performance Monitor™ in the organisation, as it is not necessary to install client software at the workstations.
Overview

A focus on the causes and source of problems
The whole philosophy of the tool’s creation is focussed on finding the real causes of efficiency problems. The system enables easy comparison of data and parameters in various sections over time. It allows one to quickly find problematic SQL queries and to understand why they are the cause of existing problems with performance efficiency.

Intuitive interface
The software has a very intuitive interface, easy to use even for users without much experience in the tuning of database efficiency.

Minimal processor load
It does not generate a noticeable load on the CPU. Other tools for measuring database efficiency generate problems related to their load on processors of the database for collecting necessary information. Sometimes this requires even 4 CPU power.

Collecting SQL statistics every 15 minutes
Our software collects statistics in time intervals of every 15 minutes, and one such cycle lasts from 5 to 30 seconds depending on the size of the database. Such an approach guarantees that the load on the database will be minimal and imperceptible even in the largest and most heavily loaded business systems. Our solution is designed in order to allow the highest number of users access to the monitoring system, without influencing the efficiency of the monitored base.

Regular updates
In order to guarantee users the highest quality, our software is constantly improved. Over a year, at least 4 new updates of DBPLUS Perfomance Monitor™ are released.

Support at the highest level
The support provided to users is provided by the technical teams directly engaged in the process of creating the software, among others.

Flexible pricing policy
The TCO indicator, i.e. the solution capabilities of DBPLUS related to the cost of purchase and use, is in the case of our software unattainable for our competition.
Resources

Download installation programme
Download a fully function 30-day TRIAL version of the software. If after 30 days you do not decide to purchase a full licence, the system will shut down certain advanced functions but it will still be possible to use its basic functionality available in the free version.

Check out our demo online
Before installing the program in your environment, you can get to know its interface and functionality thanks to a fully functional demo version available online.

Download User’s Manual
It contains information on the requirements, solution architecture and a description of the installation process and other technical instructions for the Performance Monitor application for the indicated database platform.
Download informational materials
Discover the basic features of DBPLUS Performance Monitor.
Knowledge base
Locks by Application Issues
Analysis of locks issues with the use of Performance Monitor.
Locks by Ineffective Query
Analysis of the problem of locks cause by ineffective queries on SQL Server and how users can solve it use Performance Monitor software.
Memory Usage Issues (SQL Server)
Analysis of SQL Server instance memory usage issues with the use of Performance Monitor.
Execution Plan Change
Analysis of performance problems which result from changing query execution plan with the use of Performance Monitor.
Ineffective Execution Plan
Analysis of performance problems which result from ineffective query execution plan with the use of Performance Monitor.
show all (5)
hide
FAQ
1. Do you offer support for a free test of your software?
When you want to test our software, we can support you with its installation and configuration. Additionally, we offer a free “Performance Audit” service, where we check performance and reports on system bottlenecks basing on the testing usage of our tool. If during the software test you encounter any problems with using it, you can contact us by telephone (6:00AM-2:00PM GMT) or send us a message by email, and we will provide you with support to solve the problem.
2. Can you test DBPLUS Performance Monitor?
You can download from our website installation version of our software and use the full version for 30 days. If after 30 days you do not want to decide to buy a full version license, the program will automatically switch to free mode, where advanced features are unavailable, but you can monitor the basic performance parameters.
3. What is the DBPLUS Performance Monitor license model?
DBPLUS Performance Monitor in both Oracle and SQL Server versions is currently licensed per database instance.
4. Is use of DBPLUS Performance Monitor safe to my database?
Our tool is perfectly safe to the database. It does not changes anything in the database on its own and is not generating any noticeable load for the database. Using our tool will never result in any data loss, slow down of the database or violation of the license agreement for your database and application.
Performance Monitor for Oracle
1. How to find out which databases work on a given server?
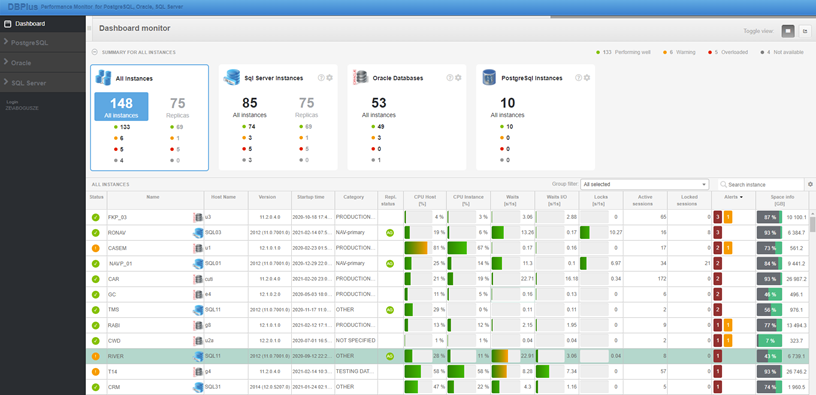
To see which databases are on the given server, go to the Dashboard screen. From the PHYSICAL SERVERS list, select the server and then all the databases on the selected server will be listed below.

2. Whether the dashboard shows the load of individual databases or that these databases are inaccessible?
By changing the view to Television mode. From this level, you can see the CPU load of the server, the duration of the locks and waits in real time.

Selecting a database from the ORACLE INSTANCES list will allow you to view performance statistics for the last 15 minutes. Data refresh is performed at 30 sec intervals for CPU, Waits, Waits details, Sessions. Other functionalities are refreshed every 15 minutes.

The Dashboard screen informs you of the inaccessibility of the database by highlighting it in gray:

3. Can I set my own alerts?
To set your own alerts, go to the Configuration > Alert settings > Alerts definition tab. Alerts can be defined on 2 levels:
- general
- for individual databases.
To define your own alert, click ”Add new alert” field.

In new pop-up window you can define your own alert, depending on your needs.

4. How to generate a report from a database load?
To generate a report from the database load, go to the Reports > Performance report tab . Then set the date range and press Run Report. Generated report contains TOP11 commands:
- The longest lasting
- The longest utilizing the CPU
- Reading the most from the hard drive
- Reading the most from the data buffer
- Most frequently run
and:
- Duration of the locks for each hour
- Top 10 longest waits and latches in the database


5. How to know how much CPU is utilized by the database and how much by all processes on the server?
To see how much CPU is utilized by the database, and how much by the server go to the Performance > Database loadscreen. When you hover over the graph, you can see values for 15 minutes. This includes CPU Time (CPU utilization by the database) and Server CPU (CPU utilization by all processes on the server).

To see how many CPUs the server is using, go to Performance > OS Stat screen. In the table below, select the CPU number and Busy Time columns. The graph will show the number of CPU occupied by the server against all allocated CPUs for the selected period.

6. Can you check how much RAM the server has and how much is assigned to the database?
To see how much RAM is allocated by the database go to the Parameters > Parameters Overview tab. In the Param name field, type SGA and search for SGA_MAX_SIZE on the list. The parameter value specifies the memory assigned to the database.

Then go to Memory > SGA tab. The screen shows how much RAM is used, how much is free (SGA TOTAL). You also see the size of the individual SGA memory components.

To check how much RAM the server has, go to the Performance > OS Stat tab. In the table below, select the Physical Memory column. The graph shows the amount of RAM on the server.

7. How to check the size and increment of a database?
To check the size and increment of the database, go to the Space monitor > Database size tab. The screen shows the total, free, and occupied space in the database for a given period. In addition, the DATABASE GROWTH section shows the database size increase in the last day, week, and month.

8. How to check the size and increment of a tablespace?
Information about the size of the database, tablespace, data files are in the Space monitortab. Functionality Last Snap Tablespace Size shows graphically and in the table the most recent data on the size of each tablespace in the database.

The same information can be obtained from the Dashboard screen. You should select the database, then Database space.

To see the increase in the tables on selected dates, check the Space Monitor > Tablespace history tab. It is possible to set the date range and to select a given tablespace.

9. How to check the setting of individual database parameters and their changes over a given period?
To check the settings of individual database parameters, go to the Parameters tab. The screen displays all parameters in the database along with the value set. When you select the parameter below, you will see the change history.

Parameters > Parameters History screen shows a list of all parameter changes for a specified period. It is possible to select a parameter by entering its name or value.

10. How to find queries that generate the largest I/O load?
To find queries that generate the largest I/O load, go to the Performance > SQL 3D tab
When looking for reads – set the Draw bar on Disk Reads to see the most burdensome queries for reads from disk devices.

When looking for writes – expand the Show additional filters bar and select Log generating statements to display the most burdensome queries for writes.

11. Which session changes the most records and consequently generates the UNDO GLOBAL problem?
To find out which session triggers UNDO GLOBAL problem, go to the Sessions > Undo usage sessions tab. Then sort the Used records column by descending order. A session with the highest number of records being processed is causing the problem.

To analyze the problem within a given period, go to the Session > Undo history tab and set the date range. When you select a point in time, select the Undo tab below and sort the used records column in descending order. A session with the highest number of records being processed is causing problems.

12. How to check which session makes the most changes to the database?
To find out which session makes the most changes to the database, go to the Sessions > Undo usage sessions tab. Then sort the Used records column by descending order. The session with the most processed records makes the most changes to the database.

13. How to determine what is responsible for generating latches related to shared_pool?
To see what generates shared_pool latches go to Performance > Latches > Latch library cache tab. In the SHARED POOL STATEMENTS section, you can see a list of queries with literals and the amount of shared pool memory used. The number of query versions is also included. Literals that are most utilizing the memory are the cause of shared_pool latches.

14. How to check the database load over a period of 2 years?
To analyze the database load over the past 2 years, go to the Performance > Load trendstab. Then set the date range for the last 24 months and set the grouping by month. By default, you see the Elapsed time graph, which shows the duration of all database queries for the selected period in the selected time grouping (15 minutes, day, month).

15. How to check who has run a given query?
To check who is triggering the query, go to the Sessions > Session / Undo history tab. When you type the query ID in the Using Query Hash field below, you will see a list of all sessions that run the query within the selected period.

16. How to check the performance statistics for a given query?
To check the performance statistics of a given query, go to the Performance > SQL Detailstab. When you enter the query ID or select it from the list, the SQL STATISTICS section displays the performance statistics for the selected period. It is possible to group results by month, day, hour and snap (15 minutes).

17. How to check the execution plan for a given query?
To check the execution plan, go to the Performance > SQL Details tab. When you enter a query ID or select it from the list at the bottom, you will see an execution plan on the Explain plan tab.

Sometimes, the query uses more than one execution plan. Checking the Compare Plansbox shows the second execution plan. This way you can list the differences and find out why the execution is slower on given execution plan.

You can also check the execution plan for an active session. To do so, go to the Sessions tab. When you select the session below, the query text and execution plan will appear.

18. How to find out how many queries are using given execution plan?
To find out how many queries are using this execution plan, select the command in the SQL Details tab, and then click Add to SQL plan.

Then go to the SQL Plan tab and select the previously added execution plan from the list on the left. The overall performance statistics for the execution plan appear, and when you select the Statements using plan tab, you can see all the queries that use given execution plan.

19. How to check if the database memory buffer is configured in AUTO or MANUAL?
The type of memory configuration can be found in the Memory > SGA tab, in the SGA Usage field.

20. What values are set for each component of the database memory buffers?
You can find individual components of memory buffers in the Memory > SGA tab in the CURRENT MEMORY UTILIZATION section. When you hover over a segment on the graph, it will show its value.

21. How to check the history of SGA parameter settings?
To check the history of SGA settings, go to the Memory > SGA History tab. You see the occupancy of the individual SGA elements for the selected period.

22. Which sessions utilize the most tablespace for sorting?
To check which session most utilizes the sorting tablespace, go to the Sessions > Sort usage sessions tab. You can see the tablespace for sorting and the list of sessions that use this space. Then, to display the searched sessions, you should sort Space Used column in the descending order.

23. Are there literals in the database, and if so, are they a problem?
To check whether there are literals in the database, go to Performance > Latches > Latch library cache tab. In the SHARED POOL STATEMENTS section, you can see a list of queries with literals and the amount of shared pool memory used.

Literals are a problem when in the database appear SHARED POOL type latches. To verify the occurrence of the latches, go to the Waits > Analyze tab, then set the date range and grouping. In the WAIT STATISTICS section, look for the wait latch: shared pool. If the waiting time is at a negligible level compared to the duration of all processes – there is no problem with literals.

24. What is the source of performance problem – database, disk array or user’s application?
There are several performance issues that do not have a cause in the database:
- Network problems
- Slow processing on the application side
- Slow operation of the disk array
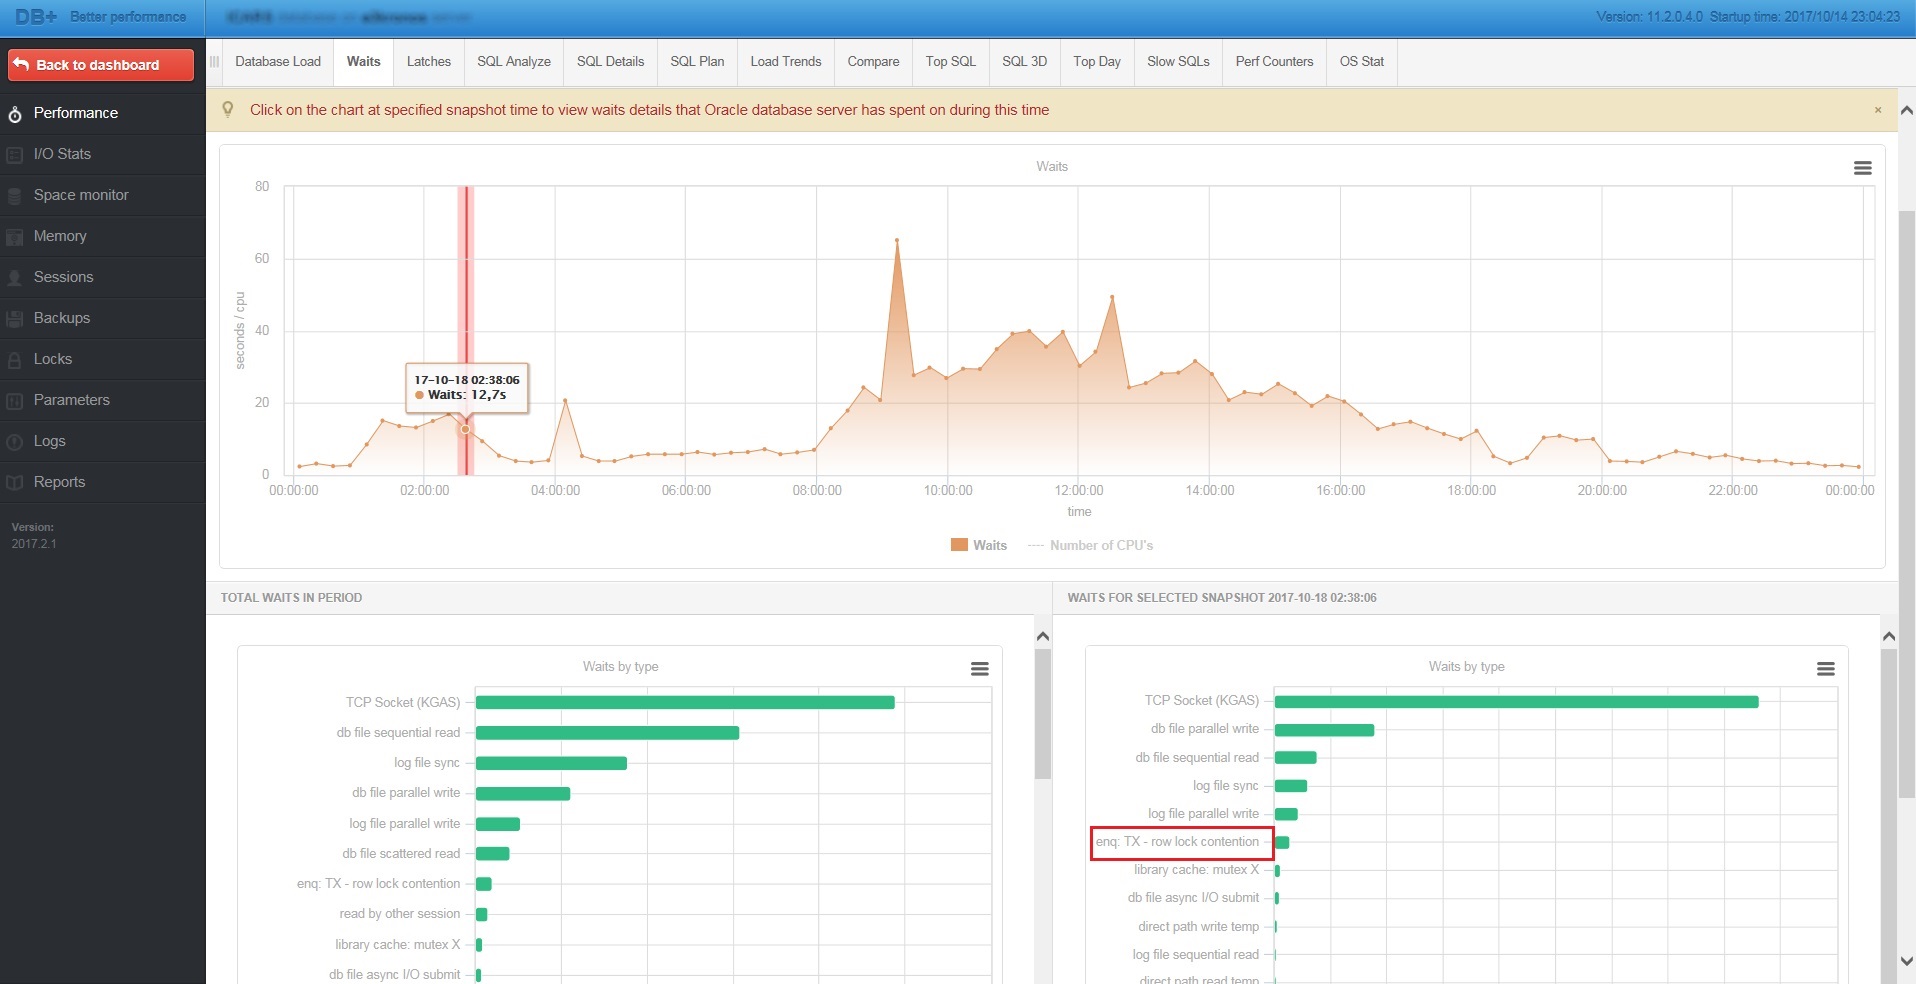
To verify that there is a problem in the database with the long wait for a network response, go to the Waits > Overviewtab, then click on the selected point on the graph. If there is a high level of TCP Socket (KGAS) wait in the database – there is a problem on the network. The most often occurring waits are shown below the chart.

The problem may also occur on the disk array side. To verify this, go to the I/O Stats > I/O Analyze tab, then select Writes/Reads and Write time/Read time respectively depending on the operation being performed. If you do not see the increase in reads/writes, and the time of these operations increases considerably, then the problem lies on the hardware side or other processes on the server from outside the database put the load on the disk array.

25. How to find out which queries are most burdensome in a given category such as CPU, Executions, etc.?
To verify the most burdensome queries, go to the Performance > SQL 3D tab. Then in the Draw bar field, select the category in which the query is putting the load on the database, set the date and group the result by day, month or snap (15 minutes). Below on the 3D graph, you will see the most burdensome queries. To analyze one of them, click on the query, then View SQL detail, which will open the SQL details tab.

On the Performance > SQL details tab we will see the query text, performance statistics for the given period, and query execution plan. It is possible to group performance statistics after a snap (15 minutes), hour, day, and month.

26. Can you see what indexes are built on a given table?
In the Performance > SQL Details tab, selecting a query on the bottom screen shows the execution plan. Click on Show plan objects:

All objects used in the query are displayed on the screen. To check which indexes are on the table, click on the table name and a list of indexes will appear on the right. Clicking on the index at the bottom will show the columns used in that index.

27. How to find queries using a given index or table?
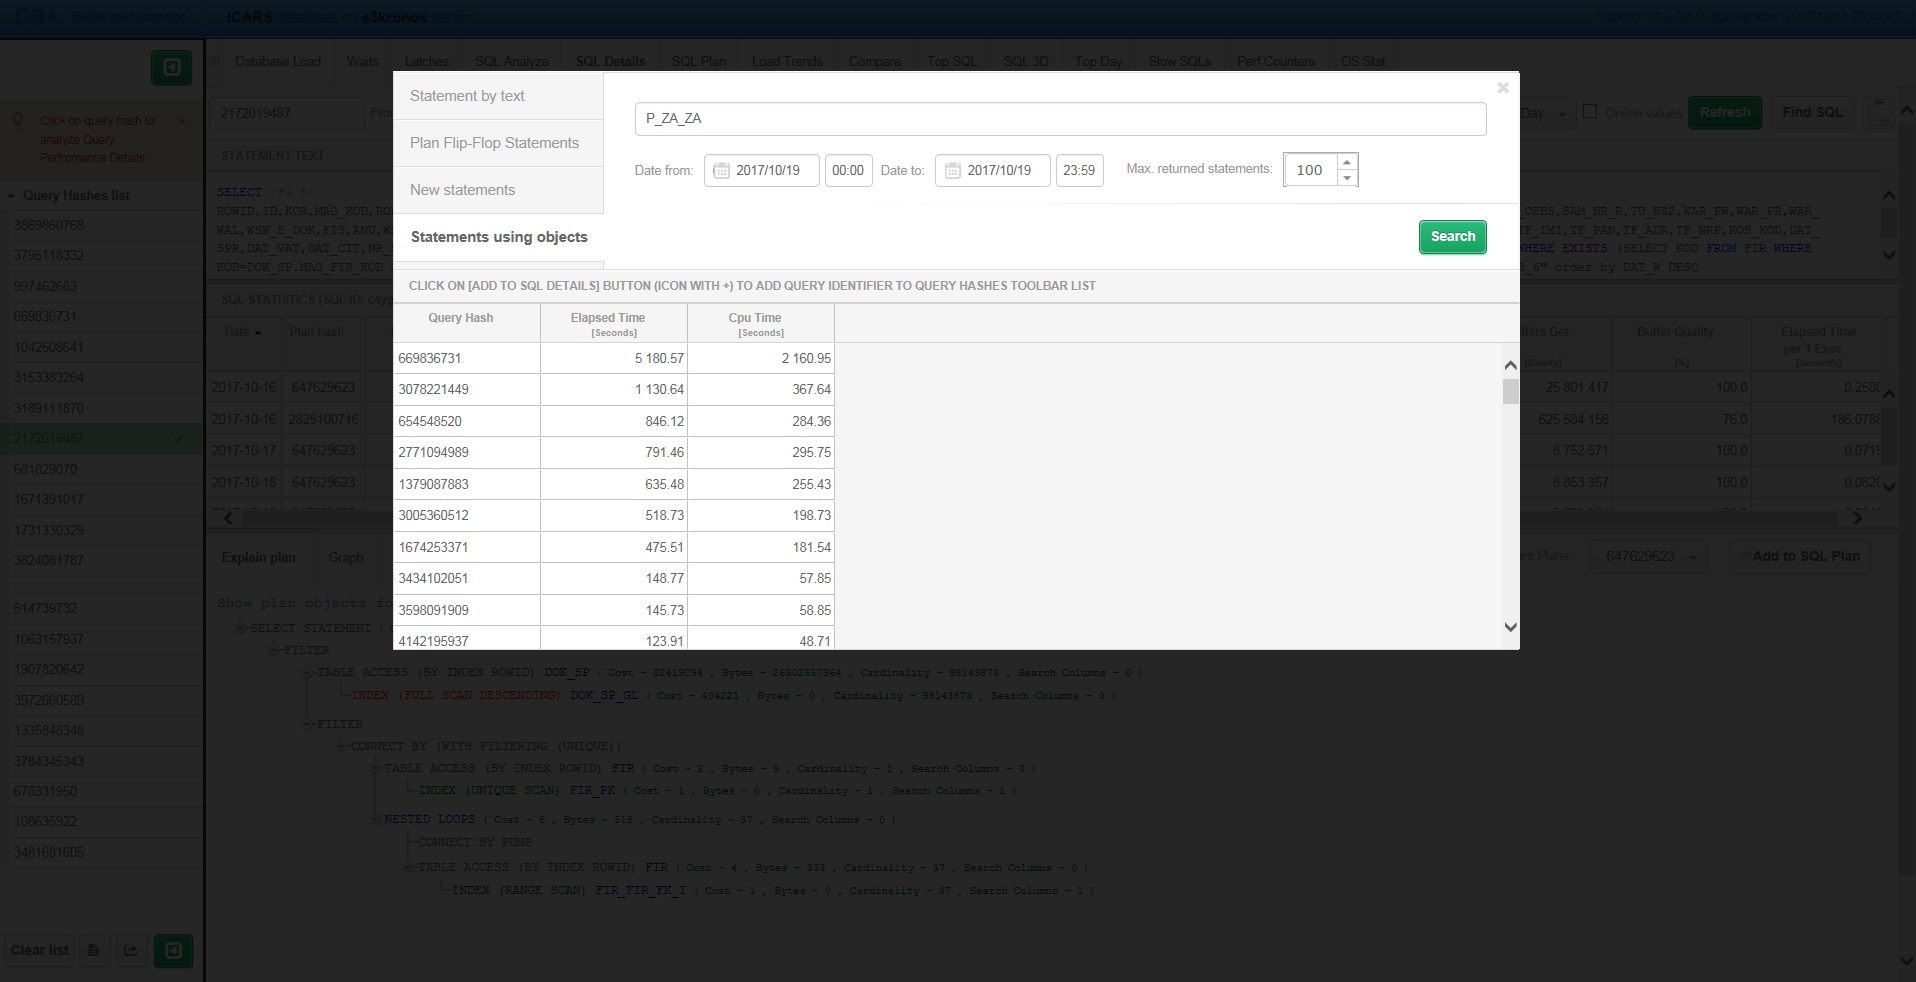
To find queries based on the used objects, go to the Performance > SQL Details tab, and then click the Find SQL button located to the right:

Then go to the Statements by text tab and enter the object name. A list of the queries that use the indicated object will be displayed below, along with the basic performance statistics for the period.
28. How to find queries that have changed the execution plan?
To find which queries have changed the execution plan, go to the Performance > SQL Detail tab, and then click the Find SQL button to the right:

Then select the Flip-Flop Statements tab. After the refresh, a list of commands that changed the execution plan for the period will appear.
29. How to compare the performance of days or periods with each other?
To compare the performance of a few days, go to the Performance > Compare > Compare Days tab. Then choose the days to compare and add them to the list. The chart contains performance data from each added day grouped after a snap or an hour. The comparison can be made for the duration of all queries, CPU time, executions, rows processed, fetches, disk reads, buffer gets.

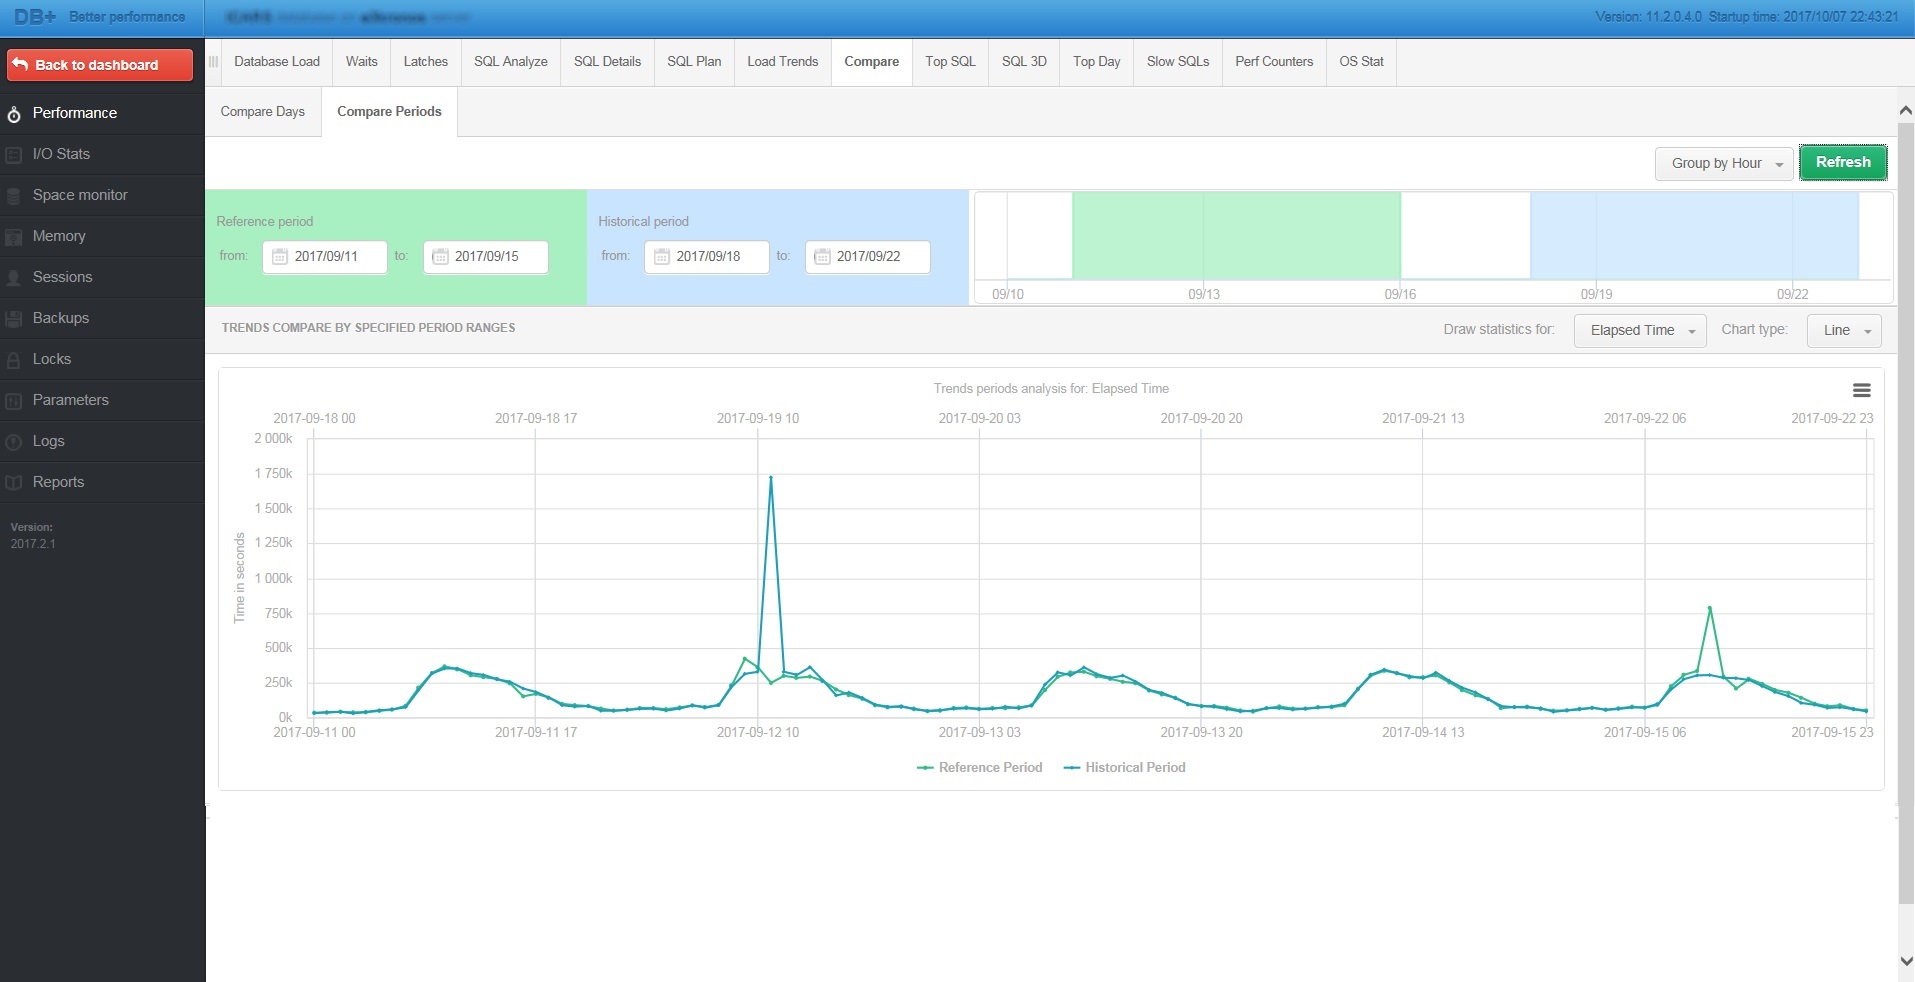
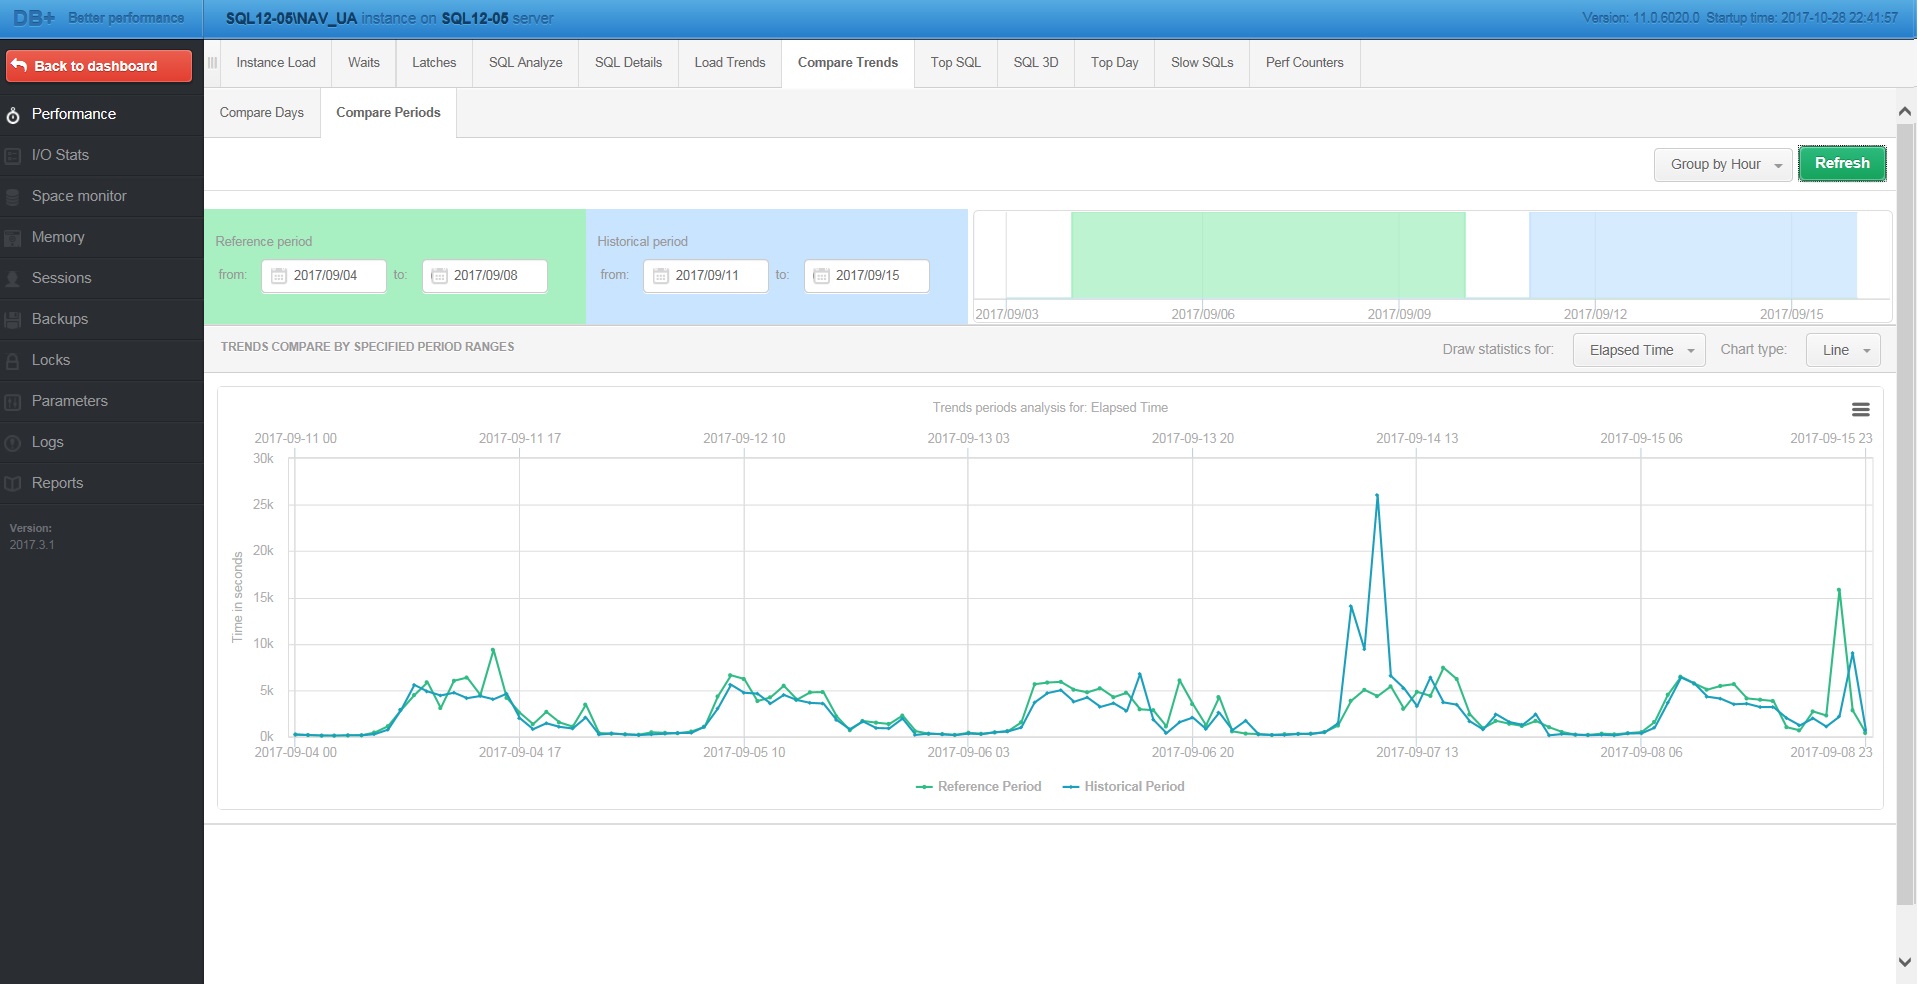
To compare the time periods, go to the Performance > Compare > Compare Periods tab. Then select two interesting periods. The chart contains performance data for each period. The comparison can be made for the duration of all queries, CPU time, executions, rows processed, fetches, disk reads, buffer gets.
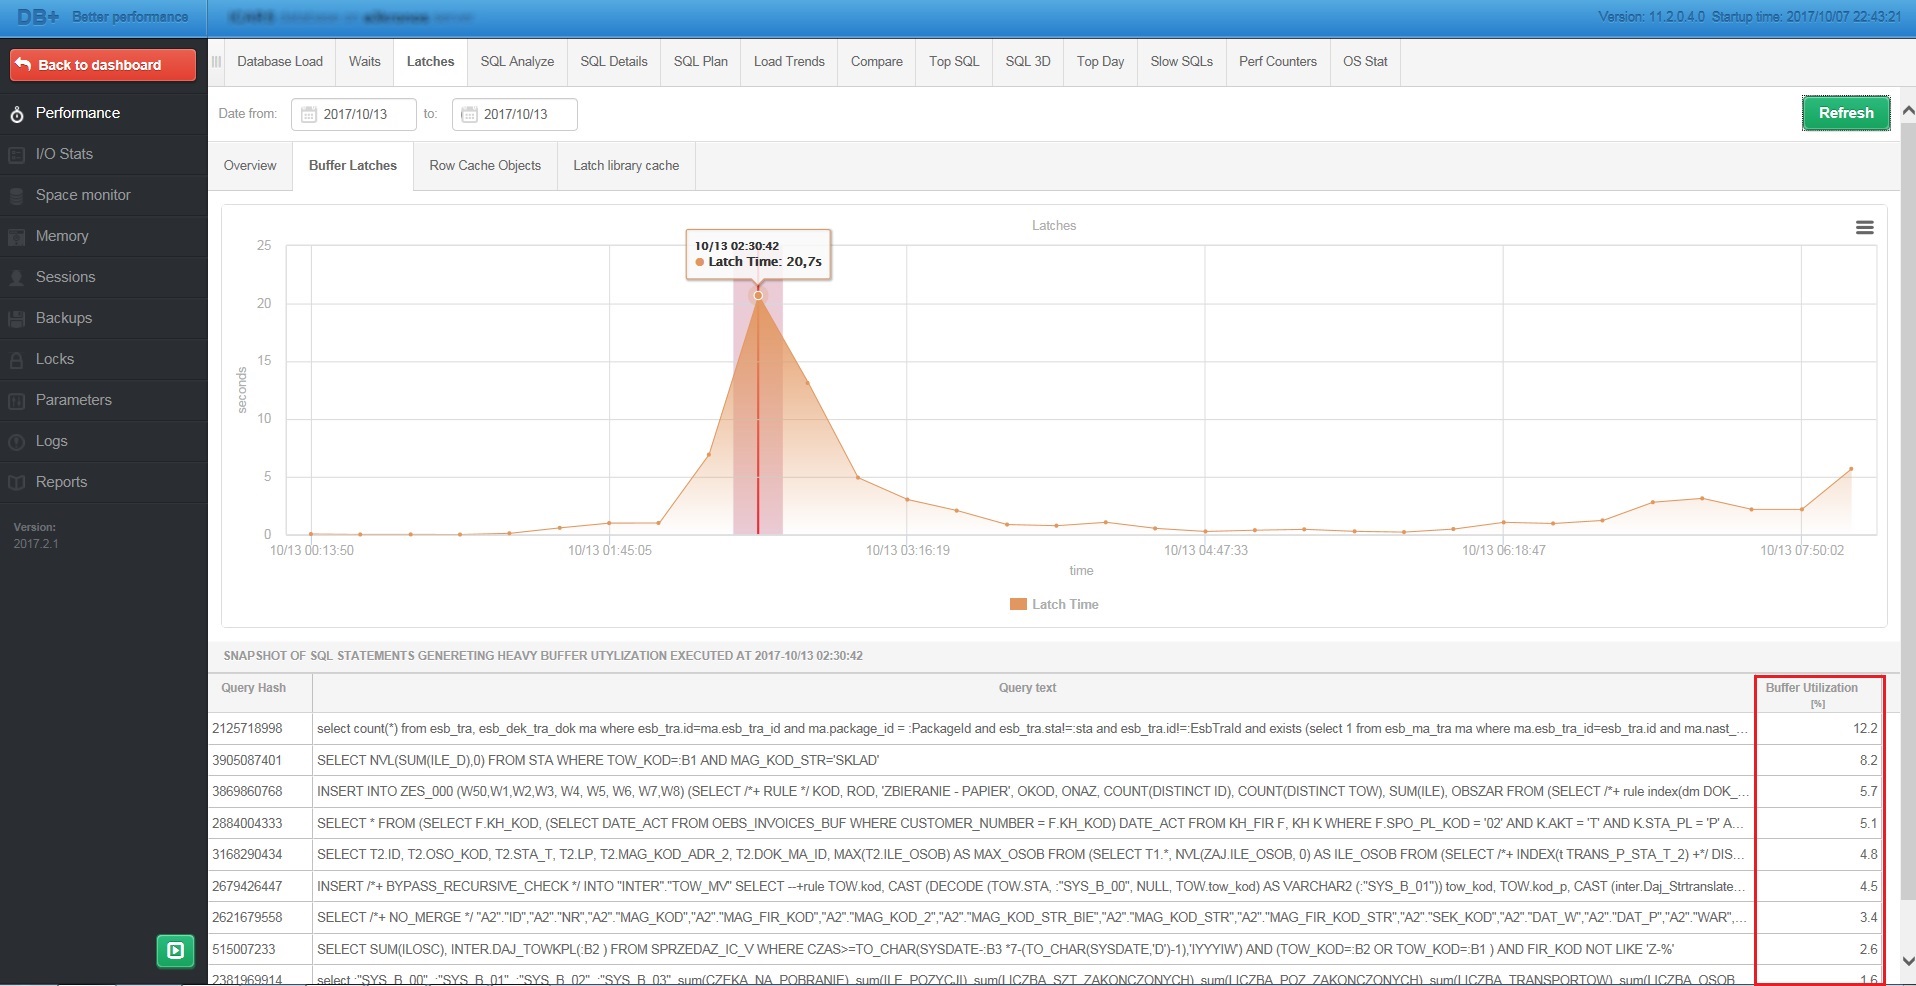
30. Which query generates latch: cache buffer chains?
To find the query generating the latch: cache buffer chains, go to the Performance > Latches > Buffer Latches tab. When you select a point on the graph, below you will see a list of queries that read the most buffers. Please check which query has the largest Buffer Utilization. It will be responsible for the appearance of latch: cache buffer chains.
31. How to find out who caused the performance problem at 2 am (sessions and queries)?
To find out who caused the performance problem at 2 am, go to the Performance > Database load tab. Then select the 2 am time point at the graph. If you see an increase in database server utilization, please check on the list below which query was responsible for this.

Then, to verify who run this command, go to the Sessions > Session / Undo history tab. Then enter the query ID and search for who has run it around 2:00.

32. How to check if there are locks in a given period? If they were, then who was blocking and who was blocked?
First, go to the Performance > Waits tab. When you click on a point on the graph, look in the wait section for the wait with “enq” in the name. If there is one, go to Locks > Locks history.
When you go to the Locks > Locks History tab, the graph shows the session timeout and the number of sessions in the lock for a given period. Clicking on a point will show you a list of blocking and blocked sessions.

In the blocking session there is an arrow with the possibility to collapse the remaining sessions below. Locked sessions can be collapsed into a lock session.
33. Is there a problem with data writes in my database?
First, you need to check if there are waits connected with write operations, i.e. log file sync, db file parallel write, parallel write log, free buffer busy. To do so, go to the Performance > Waits > Analyze tab. Then find and select indicated waits.

Then go to the I/O Stats > I/O Analyze screen. If you set the same date range as before for disk waits, you should select the Writes, Write time column. If write time increases at the wait growth point, and the number of records is not increasing, the problem lies with the disk array. If the number of writes grows, you need to find the command that writes the most data to the array in that period.
Of course, if the write time of a single 8K block of data is greater than 0.004 seconds then this indicates slow I/O support and the problem should be looked beyond the database. For SSD disk array the write time of a single 8K block is 0.003 seconds.

To find the query that writes the most data to the disk array, go to the Performance > SQL 3D tab, expand the Show additional filters bar, and select Log generating statements. The queries displayed are the most burdensome regarding writing to a disk array.

34. Is there a problem with data reads my database?
To see if there are problems with reads, go to the I/O Stats > I/O Analyze tab. Then set the date range, granularity, and select from the table below the Reads and Read time columns. If the reading time increases and the number of readings is not increasing, there is a problem with reading on the disk array. However, if the number of readings is also increasing, you should find the command that reads the most data during this period and therefore causes problems with reading.
Of course, if the read time of a single 8K block of data is greater than 0.003 seconds then this indicates slow I/O support and the problem should be looked beyond the database. For SSD disk array the read time of a single 8K block is 0.0002 seconds.

To find out which query reads the most data from the disk array go to the Performance > SQL 3D tab, set the Draw bar to Disk Reads. The queries displayed are the most burdensome regarding reading from the disk array.

35. What percentage of the load is caused by given query or queries?
To find out what percentage of the database load is caused by given query, select the Performance > SQL Details tab. After entering the query ID, we will see its content, the execution statistics for the given period, and the execution plan. On the lower tab, select Graph, and select Database load for Elapsed Time. The graph shows the duration of the command and its percentage of all queries in the database.

To see how much load to the database is caused by several selected queries, go to the Performance > SQL Analyze tab. The graph shows the duration of all the commands selected below against all queries in the database.

36. Is it possible to substitute literals in queries with variables?
To substitute literals for variables, first, go to the Performance > SQL Details tab. If you select a query, check the Online value field. Then, at the very bottom of the execution plan, values will be substituted for variables along with their data type. Then match the values to the variables in the text of the query.

show all (36)
hide
Performance Monitor for Microsoft SQL Server
1. How to find out which SQL instances work on a given server?
To see which instances are on the given server, go to the Dashboard screen. From the PHYSICAL SERVERS list, select the server and then all the instances on the selected server will be listed below.

2. Whether the dashboard shows the load of individual SQL instances or that these instances are inaccessible?
The Dashboard screen gives you the ability to check the load on individual instances.
By changing the view to Television mode. From this level, you can see the CPU load of the server, the duration of the locks and waits in real time.

Selecting a database from the SQL INSTANCES list will allow you to view performance statistics from the last 15 minutes.

The Dashboard screen informs you of the inaccessibility of an instance by highlighting it in gray:
3. Can I set my own alerts?
To set your own alerts, go to the Configuration > Alert settings > Alerts definition tab. Alerts can be defined on 2 levels:
- general
- for individual databases.
To define your own alert, click Add new alert button.
In the new pop-up window, you can define your own alert, depending on your needs.
4. How to generate a report from an SQL instance load?
To generate a report from the instance load, go to the Reports> Performance report tab. Then set the date range and press Run Report. Generated report contains TOP11 commands:
- The longest lasting
- The longest utilizing the CPU
- Reading the most from the hard drive
- Reading the most from the data buffer
- Most frequently run
And:
- Duration of the locks for each hour
- Top 10 longest waits and latches in the instance
5. How to know how much CPU is utilized by the SQL instance and how much by all processes on the server?
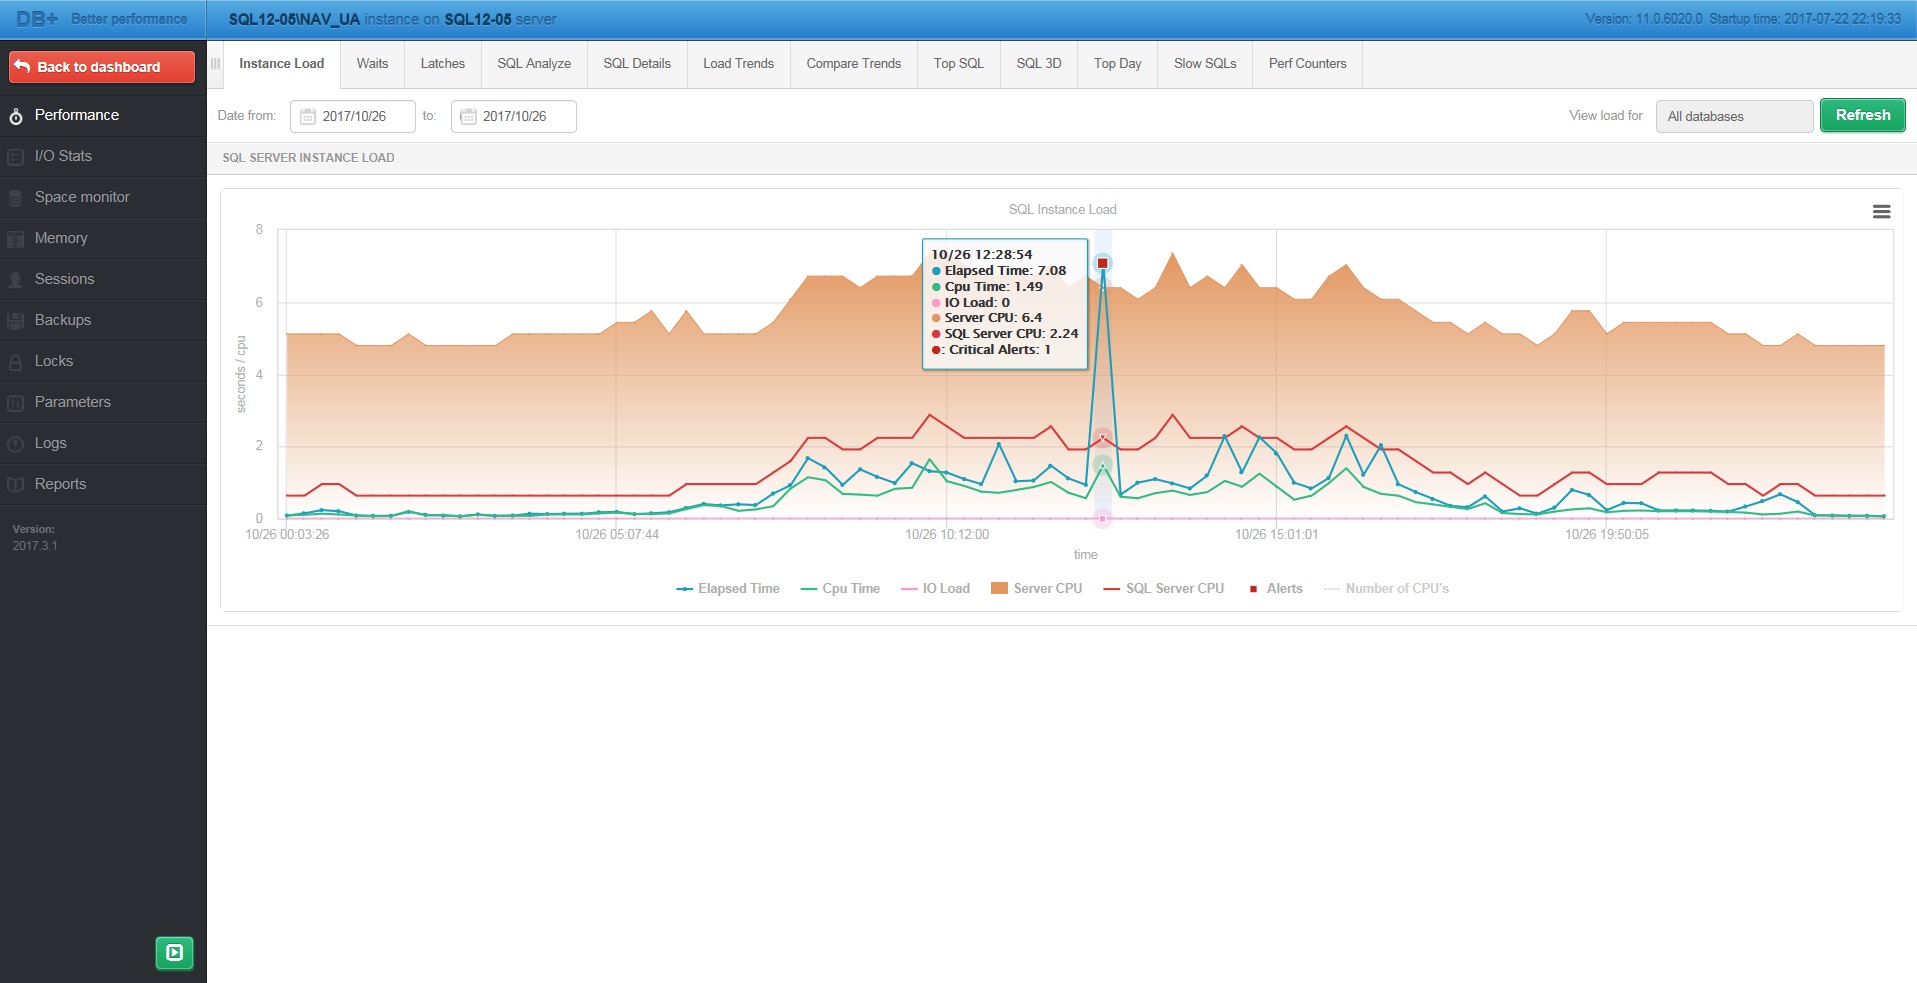
To see how much CPU is utilized by the instance, and how much by the server go to the Performance > Instance loadscreen. When you hover over the graph, you can see values for 15 minutes. This includes CPU Time (CPU utilization by the instance) and Server CPU (CPU utilization by all processes on the server).
6. Can you check how much RAM the server has and how much is assigned to the SQL Server?
For information about the amount of RAM allocated, go to the Memory> Memory usage tab. You can see how much RAM is used by the instances, and how much free memory the server has (TOTAL SERVER MEMORY) and in what proportion of memory is divided (Memory Utilization).

7. How to check the size of SQL instances or individual databases?
To check the size of the instance, go to the Space monitor> Current space tab. The screen shows the total, free, and occupied space in the instance.

To check the size of individual databases, you should group the result by the database:

8. How to check the increment of SQL instances or individual databases?
To check the increment of an instance, go to the Space monitor > History tab. The screen shows the total, free and occupied space in the instance for the selected period. To check the increment for each database, you should group the result by the database.

9. How to check the setting of individual instance parameters and their changes over a given period?
To check the settings of individual parameters, go to Parameters > Instance Parameters > Server Configuration Parameters Overview. The screen displays all parameters in the database along with the set value. When you select the parameter below, you will see the change history.

Parameters > Parameters History screen shows a list of all parameter changes for a specified period. It is possible to select a parameter by entering its name or value.

10. How to check the setting of individual database parameters on an SQL instance and how they change over a given period?
To check the settings of individual database parameters, go to the Parameters > Database Parameters > Database Parameters Overview tab. The screen displays all parameters in the database along with the set value. When you select the parameter below, you will see the changes history.

Parameters> Database Parameters > Database Parameters History screen shows a list of all parameter changes for a specified period. It is possible to select a parameter by entering its name or value.

11. How to find queries that generate the largest I/O load?
To find queries that generate the largest I/O load, go to the Performance > SQL 3D tab. Set the Draw bar on Disk Readsto see the most burdensome queries in regards to reads from the disk array.

12. How to check which session makes the most changes to the database?
To find out which session makes the most changes to the instance, go to the Sessions > Log usage sessions tab. Then sort the Log record count column in descending order. The session with the highest number makes the most changes.

13. Which queries write the most data blocks into memory?
To find the commands responsible for the shared_pool latch, go to the Performance > SQL 3D tab. Then set the Draw barto Buffer Writes to see the queries that write the most data to the memory.

14. How to check an SQL instance load over a period of 2 years?
To analyze the instance load over the past 2 years, go to the Performance > Load trends tab. Then set the date range for the last 24 months and set the grouping by month. By default, you see the Elapsed time graph, which shows the duration of all queries on the instance for the selected period.

15. How to tell which database queries generate the largest load?
To see in which database queries generate the greatest load, go to the Performance > SQL Analyze tab. By clicking on the Database Load tab and sorting the table in the descending order by the Elapsed Time column, you will see a list of the most heavily loaded databases.

The second way to determine in which database queries generate the greatest load is to go to the Performance > Instance load tab. Then click All databases in the upper right corner. You will see a table showing the share of each database load for the selected period.

16. How to check who has run a given query?
To check who is triggering the query, go to the Sessions > Active Sessions / Log usage sessions history tab. When you type the query ID in the Using Query Hash field below, you will see a list of all sessions that run the query within the selected period.

17. How to check the performance statistics for a given query?
To check the performance statistics of a given query, go to the Performance> SQL Details tab. When you enter the query id or select it from the list, the SQL STATISTICS section displays the performance statistics for the selected period. It is possible to group results by month, day, hour and snap (15 minutes).

18. How to check the execution plan for a given query?
To check the execution plan, go to the Performance > SQL Details tab. When you enter a query ID or select it from the list at the bottom, you will see an execution plan on the Explain plan tab.

Sometimes, the query uses more than one execution plan. Checking the Compare Plans box shows the second execution plan. This way you can list the differences and find out why the execution is slower on given execution plan.

You can also check the execution plan for an active session. To do so, go to the Sessions tab. When you select the session below, the query text and execution plan will appear.

19. How much memory on the server is used by SQL instances?
To see how much memory is used by the instances, go to the Memory> Memory usage tab. On the right side of the screen there is a chart on which you can see:
- the amount of available RAM and its usage by all processes running on the server (bar on the graph below in blue box)
- amount of memory used by SQL instances (bar on the graph below in green box)

20. How to check whether an SQL instance uses the allocated memory in 100%?
To verify that the SQL instance uses 100% of the allocated memory, go to the Memory > Memory usage tab. Then compare Max Server memory with the amount of memory used by the instance. In addition, you should verify that the memory areas (Memory Utilization for last snapshot section) sum to the total memory size – then we know that SQL uses allocated memory at 100%.

21. What values are set for each memory area of an instance?
You can find individual memory buffers in the Memory > Memory usage section of the MEMORY UTILIZATION section. When you hover over a segment on the graph, it will show its value.

22. How to check the memory settings history?
To check the memory settings history, go to the Memory > Memory usage history tab. You can see the memory utilization for the selected period.

23. Which sessions utilize the most of the temporary tempdb space?
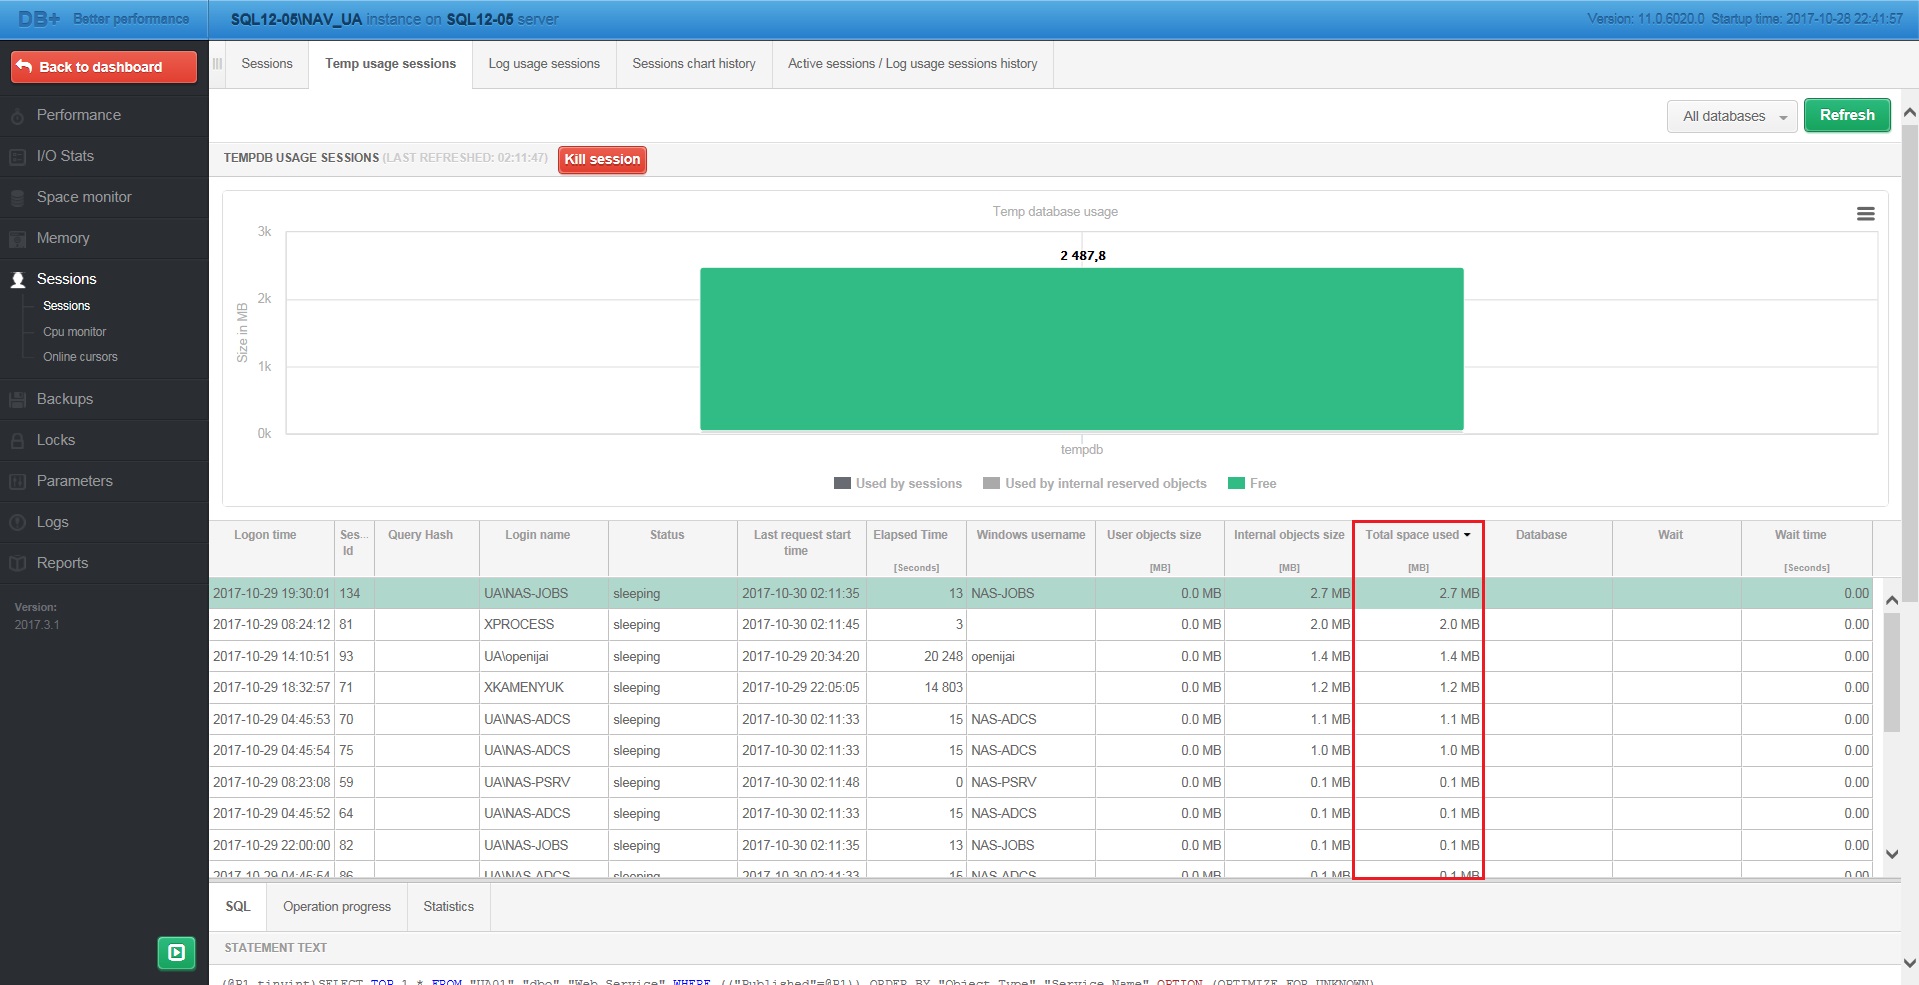
To check which session to the greatest extent uses temporary space tempdb go to the Sessions > Temp usage sessions tab. You see the occupied tempdb space and the list of sessions that use this space. Then, to display the searched sessions, the Total Space Used column should be sorted in descending order.
24. What is the source of performance problem – SQL instance, disk array or user’s application?
There 2 main performance issues that do not have their cause in the SQL instance:
- Processing on the side of the user’s application
- Slow operation of the disk array
The cause of the problem often lies in the long waiting time on the application side. In the effect, locks occur in the database. Session blocking on the instance side is inactive and doing nothing, waiting for the commit or response from the application. To analyze this problem, go to the Locks > Locks history tab. If the graph shows long-term locking and the lock session is always SLEEPING, then this is an issue with a long wait for the response from the application.

The problem may also be on the disk array side. To do this, go to the I/O Stats > I/O Analyze tab, then select Writes/Reads and Write time/Read time respectively, depending on the operation being analyzed. If you do not see the increase in reads/writes, and the time of these operations is much longer, then the problem lies on the hardware side or other processes on the server from outside the database put too much load on the disk array.

25. How to find out which queries are most burdensome in a given category such as CPU, Executions, etc.?
To verify the most burdensome queries, go to the Performance > SQL 3D tab. Then in the Draw bar field, select the category in which the query is putting the load on the instance, set the date and group the result by day, month or snap (15 minutes). Below on the 3D graph you will see the most burdensome queries. To analyze one of them, click on the query, then View SQL detail, which will open the SQL details tab.

On the Performance > SQL details tab we will see the query text, performance statistics for the given period, and query execution plan. It is possible to group performance statistics after a snap (15 minutes), hour, day, and month.

26. Can you see what indexes are built on a given table?
On the Performance > SQL Details tab, selecting a query on the bottom screen shows the execution plan. Click on Show plan objects:

All objects used in the query are displayed on the screen. To check which indexes are on the table, click on the table name and a list of indexes will appear on the right. The Index columns are the columns on which the index was created. Clicking on it at the bottom will give you detailed information about the columns.

27. How to find queries using a given table?
To find queries based on the used objects, go to the Performance > SQL Details tab, and then click the Find SQL button located to the right:
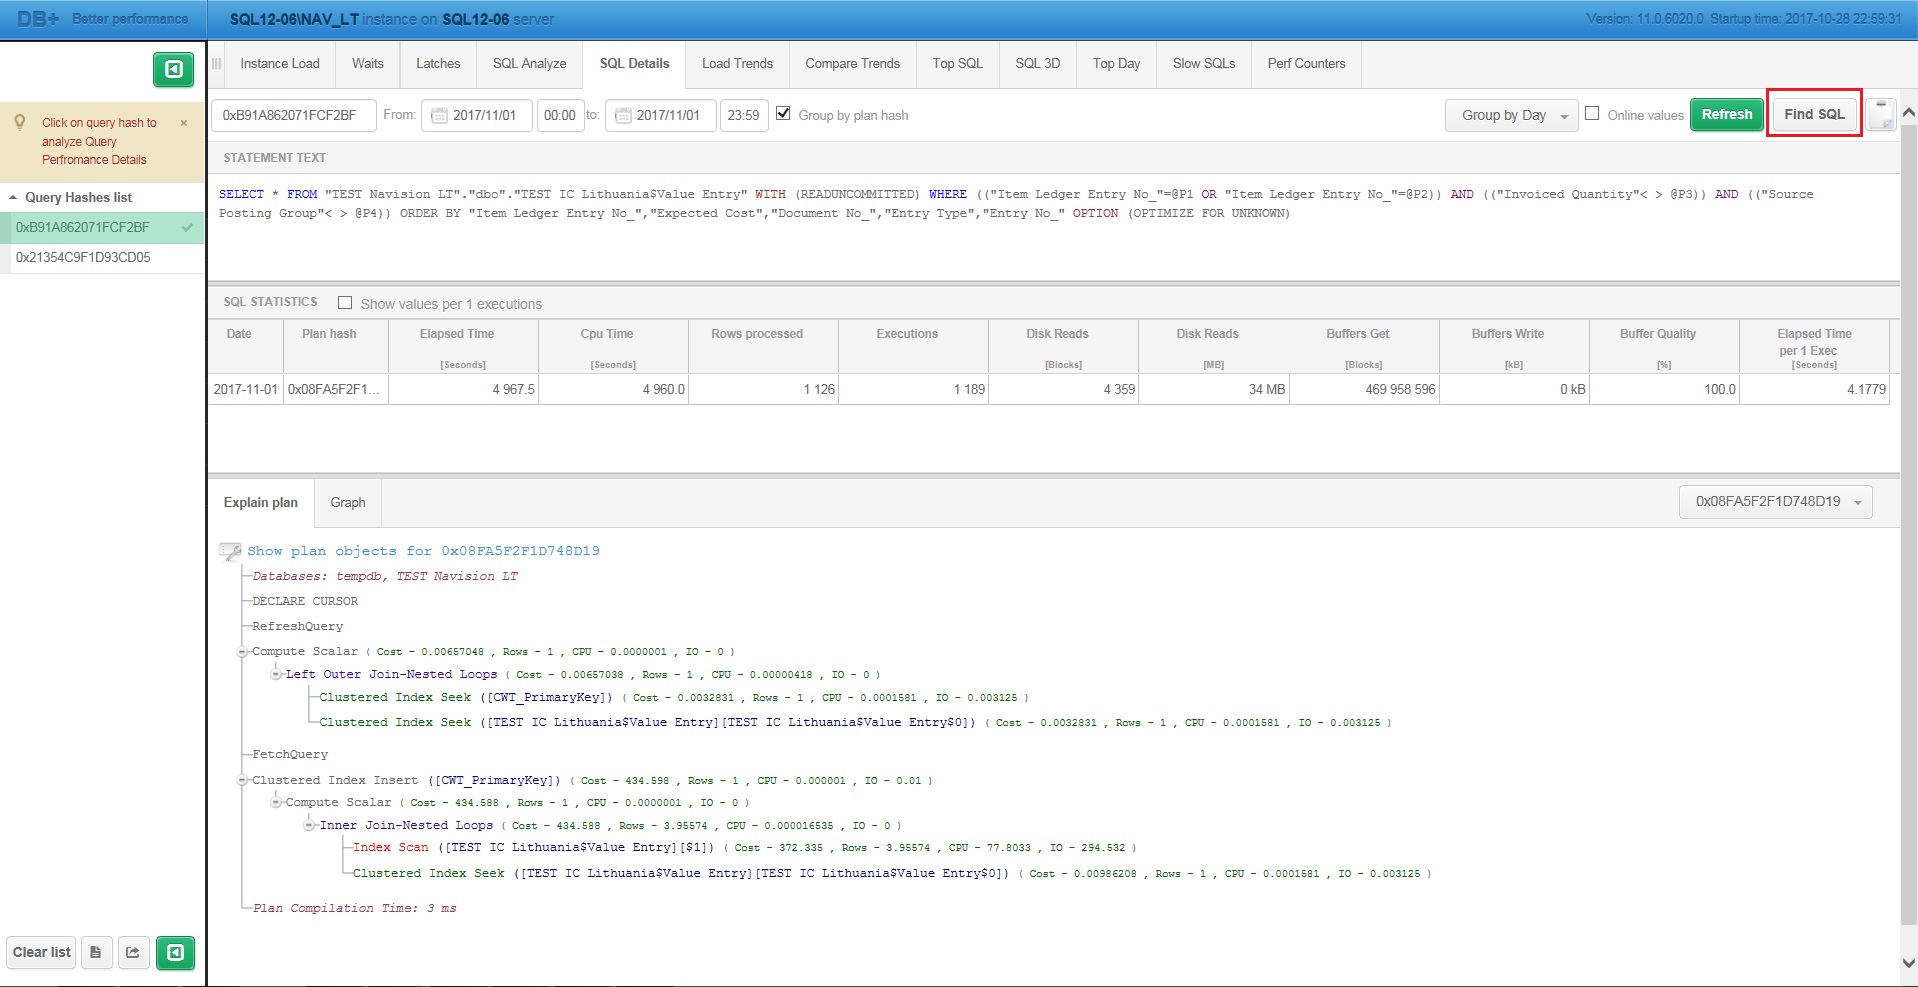
Then go to the Statements by text tab and enter the table name. A list of the queries that use the indicated table will be displayed below, along with the basic performance statistics for the period.

28. How to find queries that have changed the execution plan?
To find which queries have changed the execution plan, go to the Performance > SQL Detail tab, and then click the Find SQL button on the right:

Then select the Flip-Flop Statements tab. After the refresh, a list of commands that changed the execution plan for the period will appear.

29. How to compare the performance of days or periods with each other?
To compare the performance of a few days, go to the Performance > Compare > Compare Days tab. Then choose the days to compare and add them to the list. The chart contains performance data from each added day grouped after a snap or an hour.

To compare the time periods, go to the Performance > Compare> Compare Periods tab. Then select two interesting periods. The chart contains performance data for each period.
30. How to find out who caused the performance problem at 2 am (sessions and queries)?
To find out who caused the performance problem at 2am, go to the Performance > Instance load tab. Then select the 2 am time point at the graph. If you see an increase in instance server utilization, please check on the list below which query was responsible for this.

Then, to verify who run this command, go to the Sessions > Active sessions / Log usage sessions history tab. Then enter the query ID and search for who has run it around 2:00.

31. How to check if there are locks in a given period? If they were, then who was blocking and who was blocked? Is the problem on the SQL instance or user’s application side?
First, go to the Performance> Waits tab. When you click on a point on the graph, look in the wait section for the wait with “LCK” in the name. If there is one, follow further instructions.

When you go to the Locks > Locks History tab, the graph shows the session timeout and the number of sessions in the lock for a given period. Clicking on a point will show you a list of blocking and blocked sessions.

Next to the blocking session, there is an arrow with the possibility to collapse and expand the locked sessions below. The problem lies with the instance when the lock session is active and executes the command in the database. Conversely, when the blocking session is sleeping (sleeping status), the problem lies with the application.
32. Is there a problem with data writes in SQL instance?
First, you need to check of there are waits connected with write operations, i.e. writelog. To do so, go to the Performance > Waits > Analyze tab. Then find and select indicated wait.

Then go to the I/O Stats > I/O Analyze screen. When you set the same date range as before for disk waits, you should select the Writes & Write time columns. If write time increases at the wait growth point, and the number of records is not increasing, the problem lies with the disk array. If the number of writes grows, you need to find the command that writes the most data to the array in that period.

To find the query that writes the most data to the array, go to the Performance > SQL 3D tab. Then set the Draw bar to Buffer Writes. The queries displayed are the most burdensome when it comes to writing to a disk array.

33. Is there a problem with data reads in SQL instance?
First, you should check whether there are waits connected with disk reads i.e. pageiolatch_sh. To do so, go to the Performance > Waits > Analyze tab. Look for wait pageiolatch_sh

Then go to the I/O Stats > I/O Analyze screen. We set the same date range as before for the pageiolatch_sh wait. If read time is also increasing at the growth point of the wait, at the same time the number of readings does not increase – the problem lies with the disk array.

34. What percentage of the load is caused by given query or queries?
To find out what percentage of the instance load is caused by given query, select the Performance > SQL Details tab. After entering the query ID, we will see its content, the execution statistics for the given period, and the execution plan. On the lower tab, select Graph, and select Instance load for Elapsed Time. The graph shows the duration of the command and its percentage of all queries in the instance.

To see how much load to the instance is caused by several selected queries, go to the Performance > SQL Analyze tab. The graph shows the duration of all the commands selected below against all queries in the instance.

show all (34)
hide