In the high-tech tangle of our time, more cores usually mean a slower tick-tock in the CPU clock. The sage database administrators find themselves revisiting the old battleground of processor usage. The latest update to DBPLUS Performance Monitor (Version 2024.2) includes significant enhancements that aid in this monitoring. Particularly through its dedicated page for OS statistics—OS Stat Page.
Updated OS Stat Page
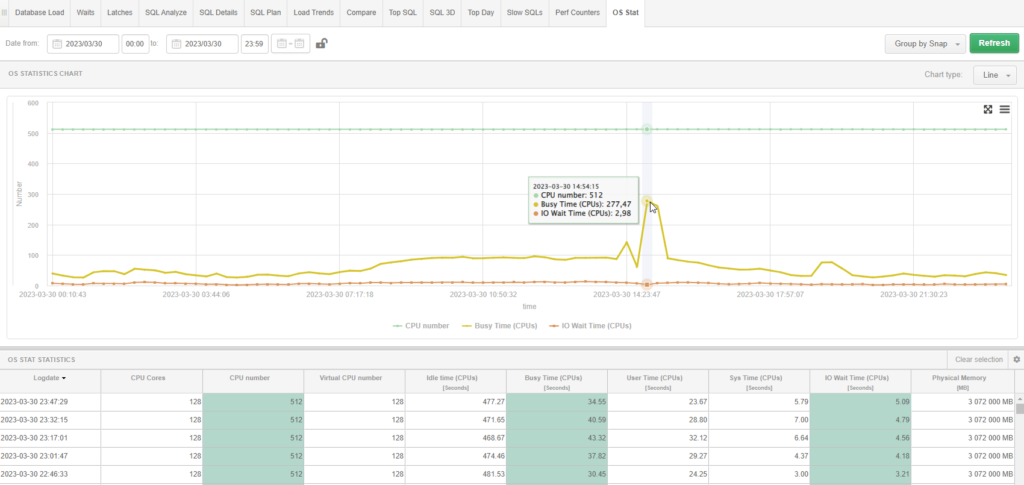
Accessible via the “Performance -> OS Stat” path or directly at DBPLUS PM OS Stat, the updated OS Stat page in DBPLUS PM offers a comprehensive overview of critical metrics that reflect the host’s health and performance. Here’s a snapshot of what you can expect.
Key Statistics to Monitor on the OS Stat Page
As the insightful article by gruffdba highlights. Since we jumped into the flashy world of all-flash storage about a decade back, CPU bottlenecks got into the spotlight. They are now the primary gremlins in our performance stories.
“Since the move to all flash storage solutions, about ten years ago, CPU utilization and bottlenecks have frequently become the primary cause of performance concerns for Oracle DBAs.”
This glimpse into the past underscores the necessity of the OS Stat page in the latest version of our software. Now more crucial than ever, this page serves as a dedicated control panel. IT addresses modern problems by displaying key stats that are essential for diagnosing and resolving those pesky performance issues. Here’s a sneak peek at the metrics waiting backstage:
Nice Time (NICE_TIME)
This statistic reports the total seconds that processors have spent executing low-priority user code. Its accumulation spreads across all processors and serves as an indicator of the time spent on less critical processes. A high Nice Time could suggest that your system has adequate CPU capacity, allowing it to allocate time to lower-priority tasks without affecting the performance of more critical processes.
Processes (LOAD)
The LOAD statistic represents the number of processes. They are either actively running or waiting in the ready queue to be executed by the CPU. This metric is a direct indicator of the load on the system. An elevated LOAD value can signal an overburdened system, where too many processes are competing for CPU time, potentially leading to slower response times and increased CPU queue lengths.
Memory Paging In (VM_IN_BYTES) and Out (VM_OUT_BYTES)
These metrics measure the volume of data being paged in (loaded from disk into memory) and paged out (moved from memory to disk) due to virtual memory management. High values in these statistics might indicate that the system is experiencing memory pressure, leading to excessive swapping as the operating system attempts to free up physical memory. This swapping can severely degrade performance, as disk I/O operations are significantly slower than memory access.
Swap Free (SWAP_FREE_BYTES)
This stat measures the amount of swap space currently available on the system. Swap space is used as an overflow for when the physical memory is fully utilized. In systems that rely on swap during peak processing times, monitoring this metric is crucial. A low or decreasing value in this metric could precede performance issues, as it indicates that the system is running out of available memory resources.
Too Many Stats? No Problem
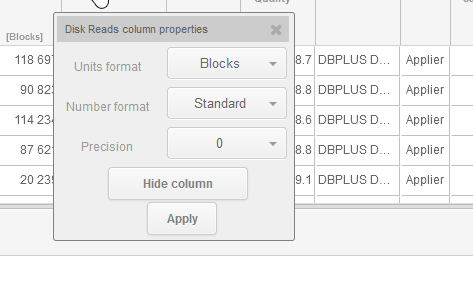
Too Many Stats? No Problem If you’re feeling overwhelmed by the sheer number of columns, fear not—you can always choose to hide the ones you don’t need. Just right-click on the column header and select ‘hide’. This feature keeps your dashboard sleek and focused, showcasing only the data that matters most to your current analysis.
Visualization Tools on the OS Stat Page.
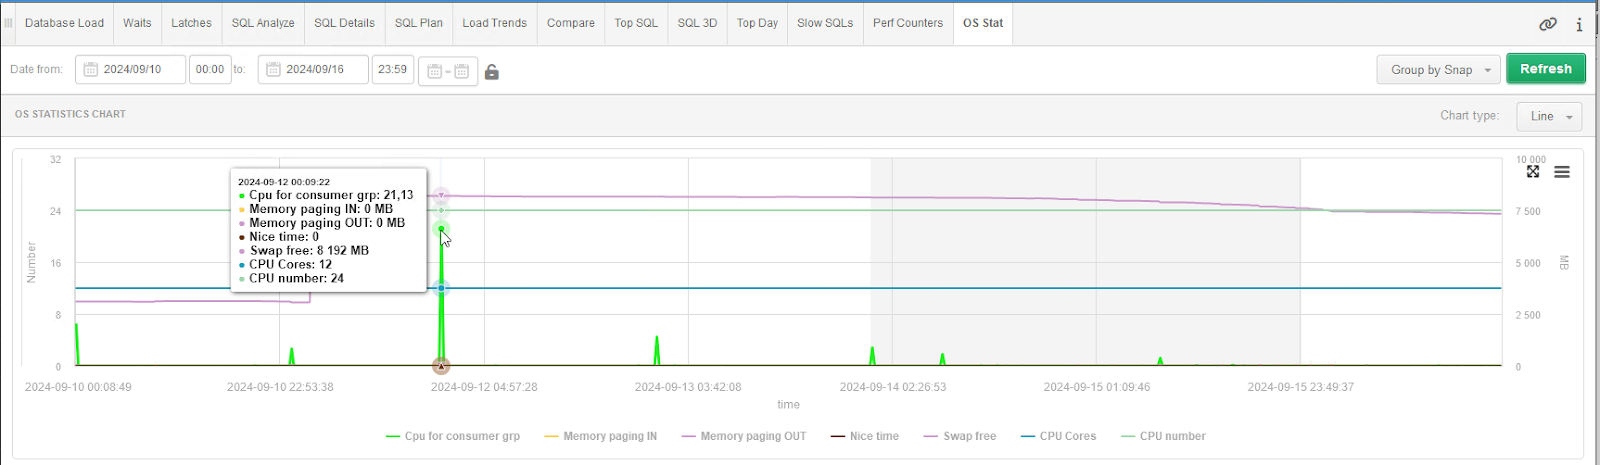
The OS Stat page includes advanced visualization tools that display these metrics in real-time. These tools are there to help administrators quickly detect spikes or unusual patterns in data, such as sudden increases in CPU load or memory swapping. By identifying these anomalies, admins can pinpoint potential issues before they escalate into serious problems, facilitating quicker intervention and resolution.
This visualization capability, highlighted by features like the OSSTAT 2 – busy spike graph, ensures that DBAs can maintain optimal performance and stability across their systems, making the OS Stat page an indispensable resource in the toolkit of every database administrator managing modern, dynamic database environments.
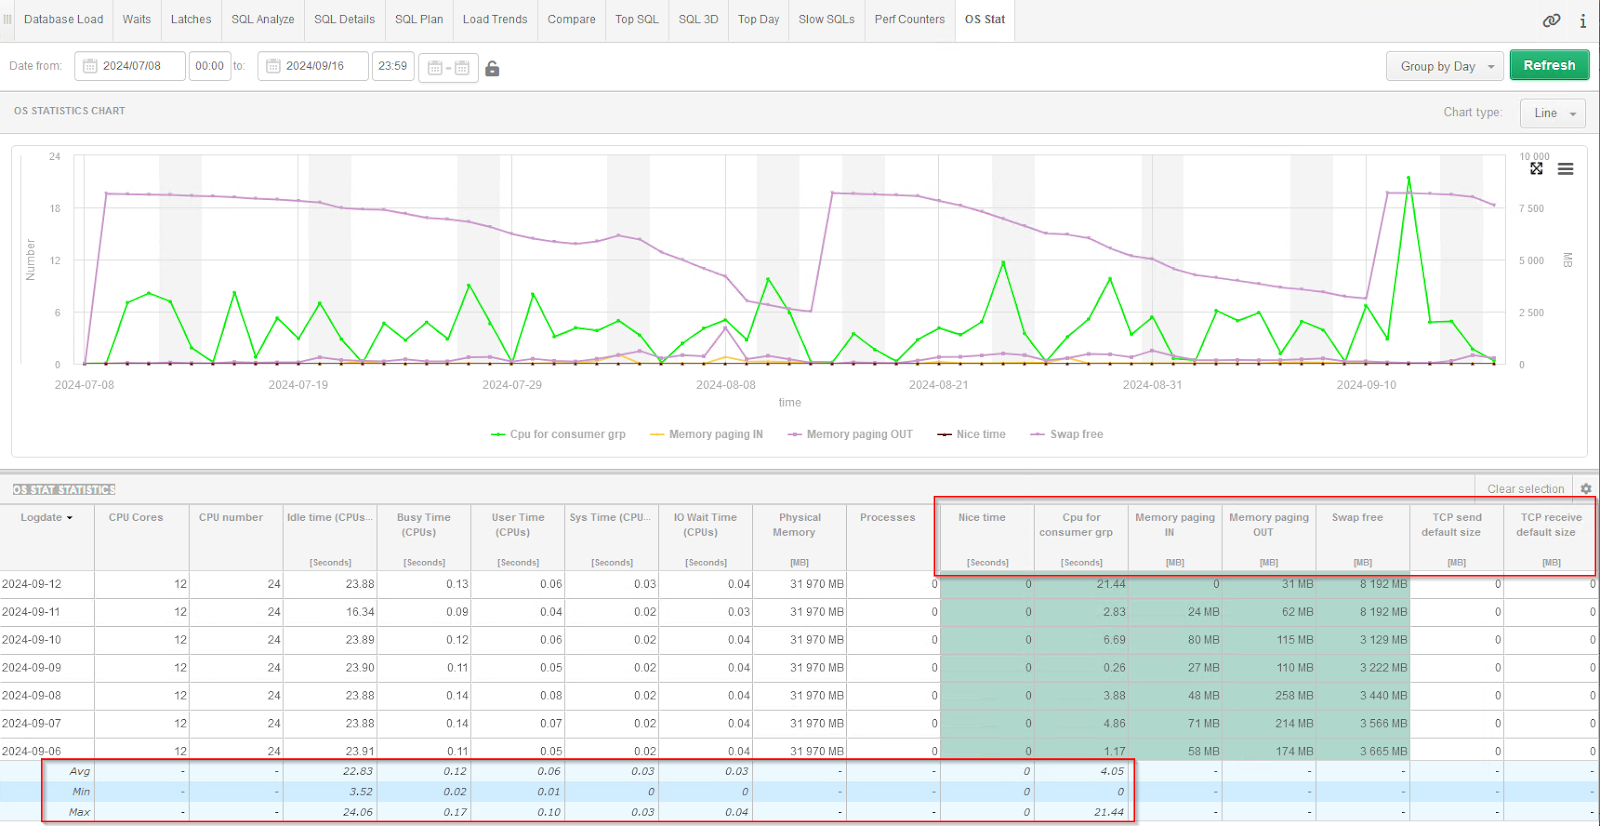
Enhanced with New Statistics
The latest release introduces several new statistics derived from the v$osstat view, which are collected every 15 minutes and presented both graphically and in tabular form:
- CPU for Consumer Group (RSRC_MGR_CPU_WAIT_TIME): This measures the total wait time for CPU resources by Oracle processes within their consumer groups, under the active resource plan.
- Global Send Size Max (GLOBAL_SEND_SIZE_MAX) and Receive Size Max (GLOBAL_RECEIVE_SIZE_MAX): These settings are crucial for tuning the network buffers, which can significantly impact data transfer rates and overall database performance.