A lot can happen in between snapshots, and that’s why we’re extremely excited to show you the solution that the newest release of the DBPLUS PERFORMANCE MONITOR brings to the table.
Online Monitor—Real-Time Data for Immediate Insights
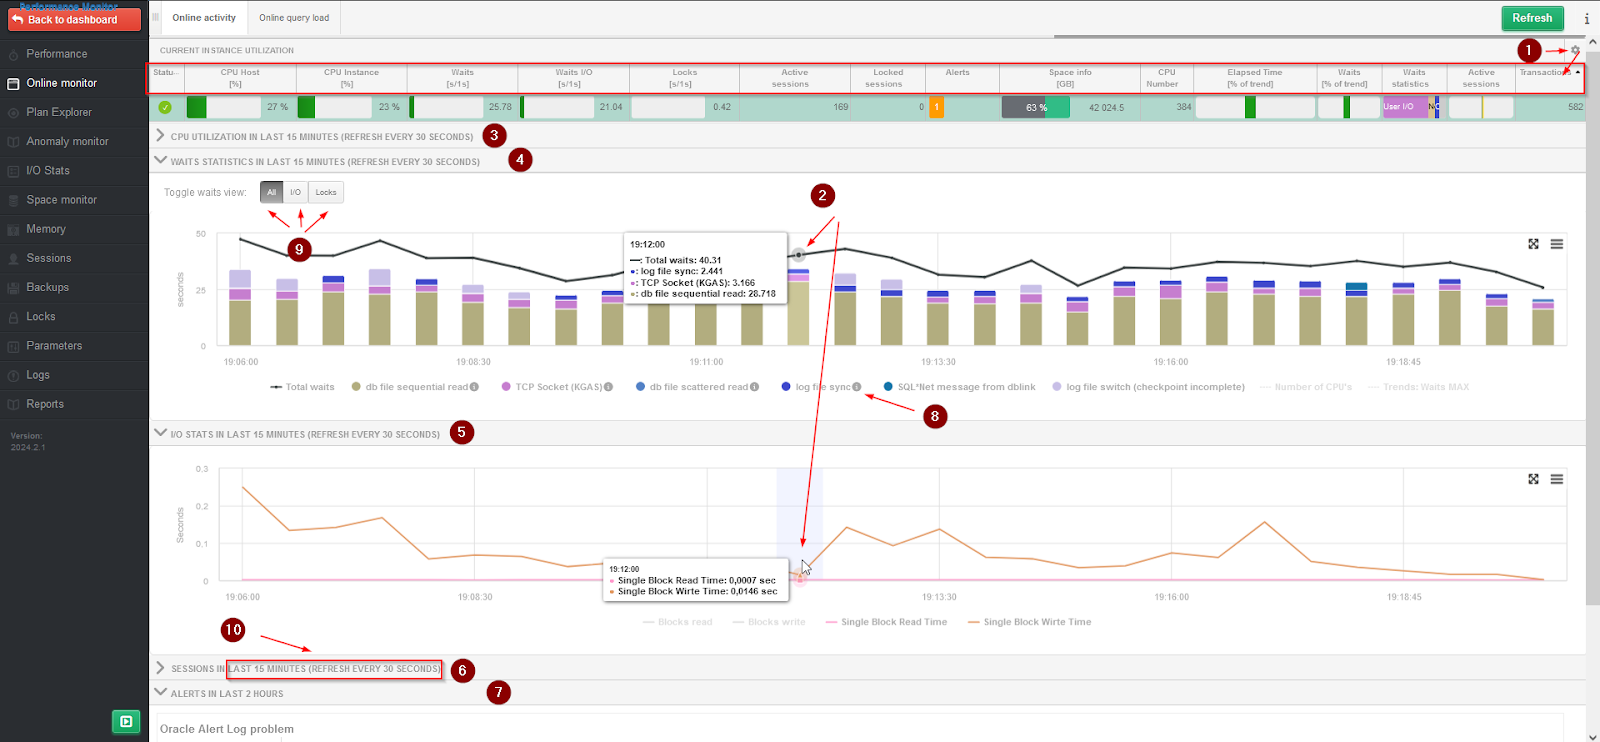
The Online Monitor refreshes every 30 seconds, giving you a snapshot of how your database has been doing for the past quarter of an hour. This near real-time look helps you catch trends and issues as they happen, not just when you think to check. This feature captures data across several vital metrics:
- Customizable Data Columns: An inconspicuous little gear icon lets you tweak which data columns you see. This means you can strip down to just the stats you care about. No clutter.
- Synchronized Time Frames: All the graphs line up by time, making it easier to compare apples to apples across different data types.
- CPU Utilization Metrics: Visual representations of CPU usage provide immediate insights into how much processing power is consumed by the server and the SQL instance.
- Wait Statistics: If your system’s performance is dragging, these stats will tell you what’s holding things up.
- Disk I/O Performance Metrics: This tells you how well your disks are keeping up with reading and writing data.
- Session Information: Shows how many sessions are active, which is a quick indicator of how busy your server is, and the concurrency in the database environment.
- Alerts: Any red flags raised in the last two hours pop up here. So you can jump on any problem extremely fast.
- Extended Wait Information: A circle icon that, when clicked, spills all the details on what’s delaying your processes.
- Easy Navigation Between Wait Sets: Users can switch between different sets of wait statistics with ease, enhancing the analysis and troubleshooting process.
- Data Range Insights: This feature gives users information about the time range for which data is being displayed, ensuring clarity on the temporal context of the data.
Visualization and Interaction with Data
The Online Monitor isn’t just about numbers and charts. It’s about making sense of those numbers in the simplest way possible. It uses synchronized graphs and summary tables, which helps you see how different metrics affect each other at a glance. Too much information? No problem. Each chart comes with an “arrow” icon that lets you minimize the details you don’t need.
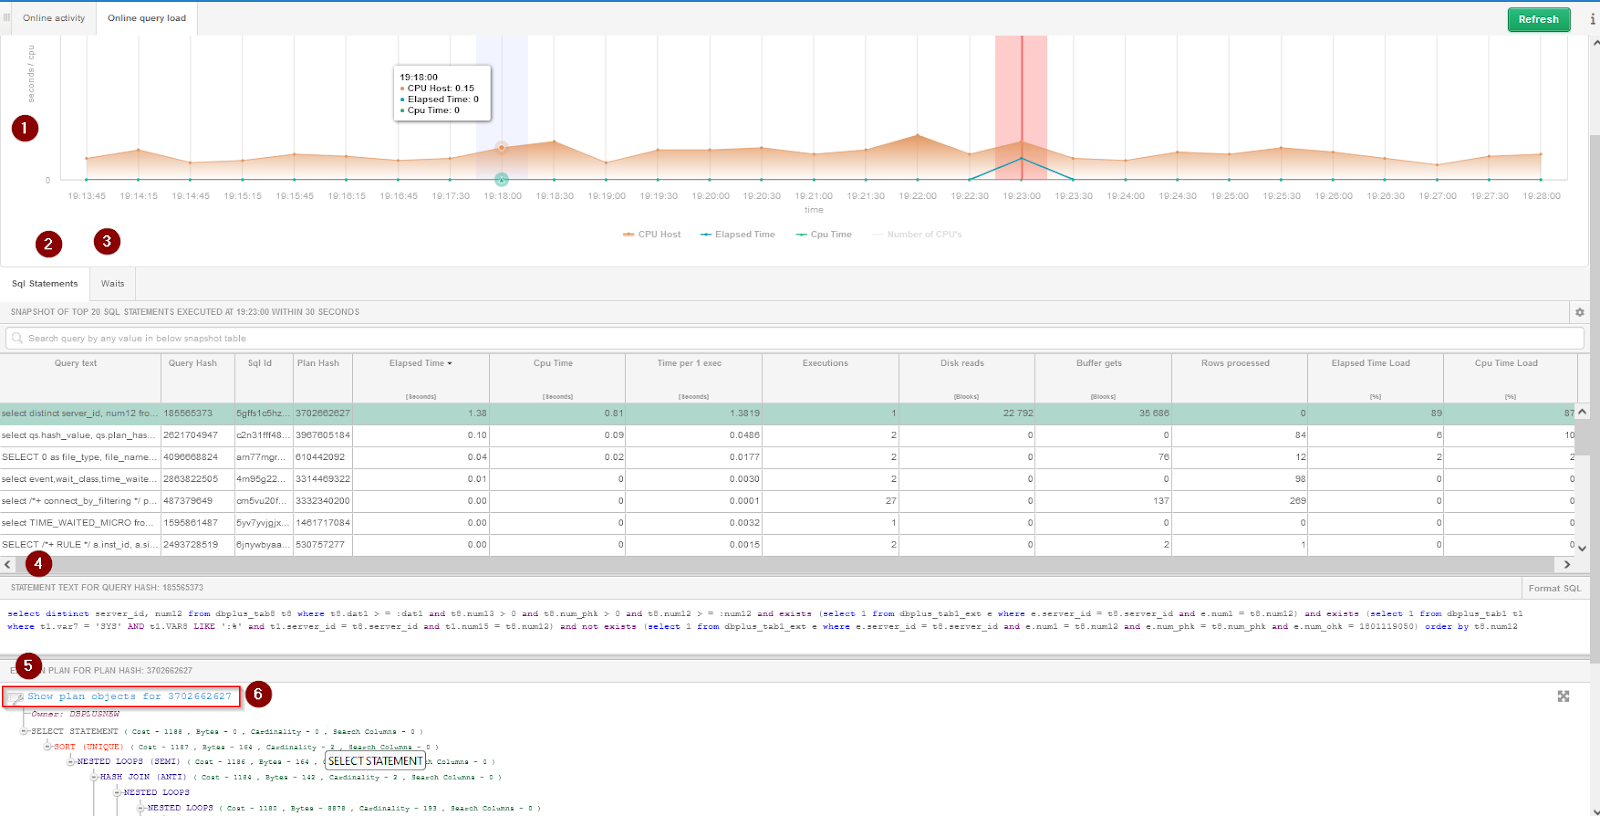
What can you expect in the ‘Online query load’ tab?
SQL Statements tab:
- Overview Section: Displays a summary of all query activities within the selected timeframe.
- SQL Details: When you click on a query, this part spills all the secrets—full SQL text and detailed stats. It gives you a clearer picture of what’s efficient and what’s not.
- Wait Statistics Section: This segment zeroes in on SQL waits. It does so by showing not just the immediate hold-ups but also their patterns over time.
- Selected SQL Details: When a particular SQL is selected in the interface, this part highlights it. Thus, giving users a focused view of that specific query.
- Selected SQL Details: Pick a query, any query. This section will highlight it and provide a deep dive, so you can scrutinize and tweak it as needed.
Waits tab:
- Overview Section: Same as in the ‘SQL Statements’ tab, it summarizes all the actions. All is within your chosen window for analysis.
- SQL Part: This segment shows active SQL queries. It allows users to select any query to explore further.
- Waits Part: The primary focus on wait statistics starts here. The tool displays the types of waits that are affecting the SQL Server performance. This section helps identify the delayed resources.
- Waits Part with Information about Current Waits: Expanding on the initial waits overview, this part gets into specific details about the current waits, providing context.
- Details about Wait Distribution in Time: Perhaps the most detailed feature, this section visualizes how waits are distributed over time, offering trends and patterns that are essential for diagnosing issues that may not be immediately apparent.

Non-Persistent Data for Reduced TCO
In the grand scheme of things, the Online Monitor plays it smart by not holding onto data longer than necessary. Instead of storing transient performance data, the DBPLUS repository remains unburdened by unnecessary data accumulation. This lean approach optimizes the total cost of ownership (TCO) in a long term.
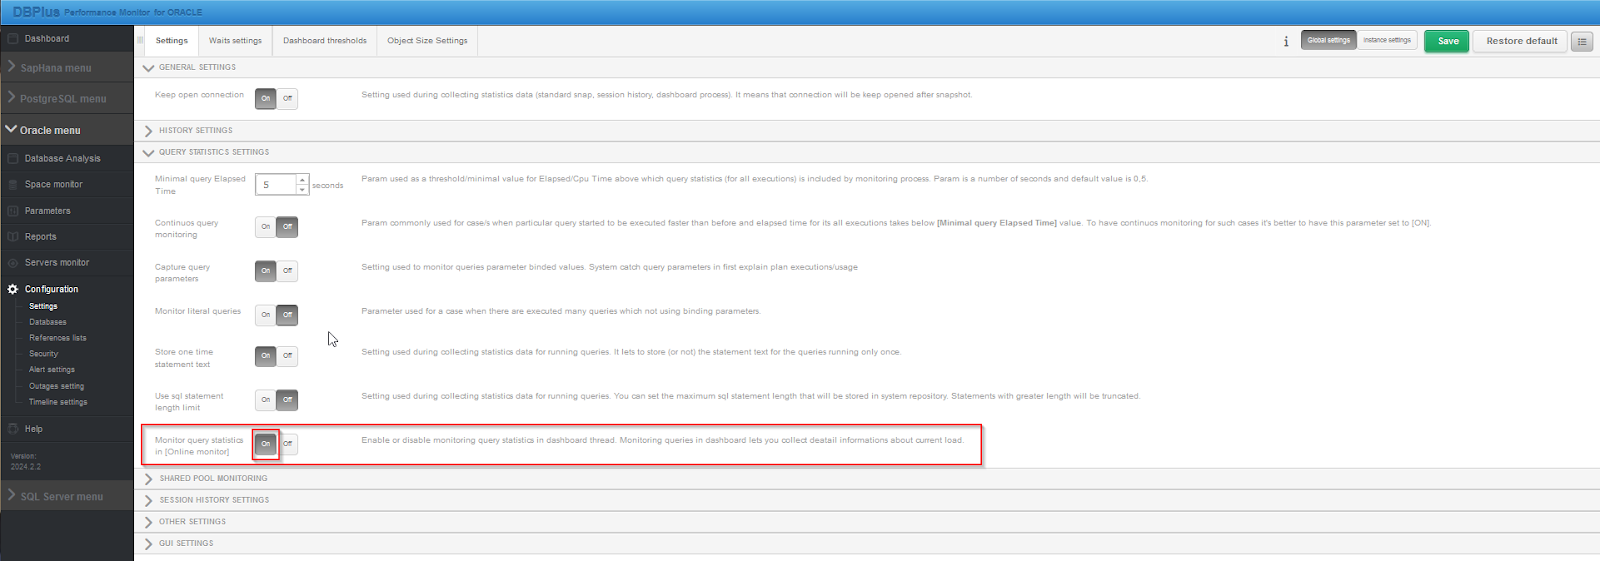
Configurable Monitoring
The DBPLUS PERFORMANCE MONITOR provides flexibility in monitoring settings. While the default setup enables monitoring out of the box, you can always tailor it to meet different needs. Through the main menu under Configuration > Settings, administrators can toggle the monitoring on or off and adjust settings at both the global and instance levels. This ensures that the performance monitoring can be as dynamic and adaptable as the environments it supports.