Performance issues rarely occur in isolation. Often, a single problem can trigger a cascade of related issues, each compounding the overall impact on the system. This case study explores such a scenario in the T10 database on the g1rush server.
Identifying the Initial Issue: Temporary Tablespace Overflow
On June 21, 2024, at 13:04:32, our DBPLUS PERFORMANCE MONITOR flagged a critical error: ORA-1652, indicating an inability to extend a temp segment by 128 in the TEMPORARY_DATA tablespace in the T10 database on the g1rush server. This error occurred due to concurrent sessions overwhelming the temp tablespace, consuming over 30GB.
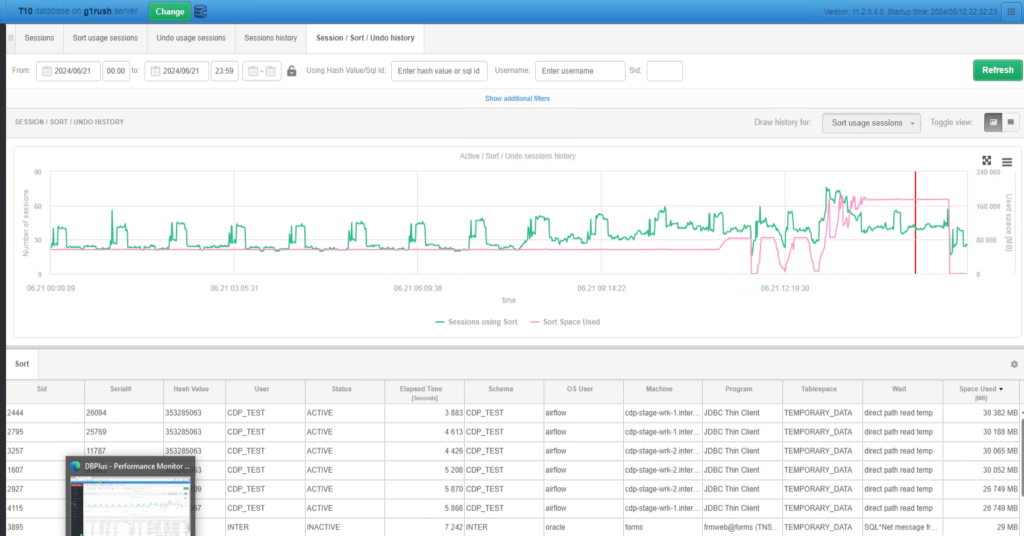
The spike in usage highlighted in the graph prompted immediate attention. This overflow disrupted ongoing operations and hinted at underlying inefficiencies in resource management.
Secondary Issue: High CPU Load
Further investigation revealed persistently high CPU load, even after reducing the number of active processes. The cyclical nature of this load, peaking during times of high activity, suggested deeper issues in query optimization and resource allocation.
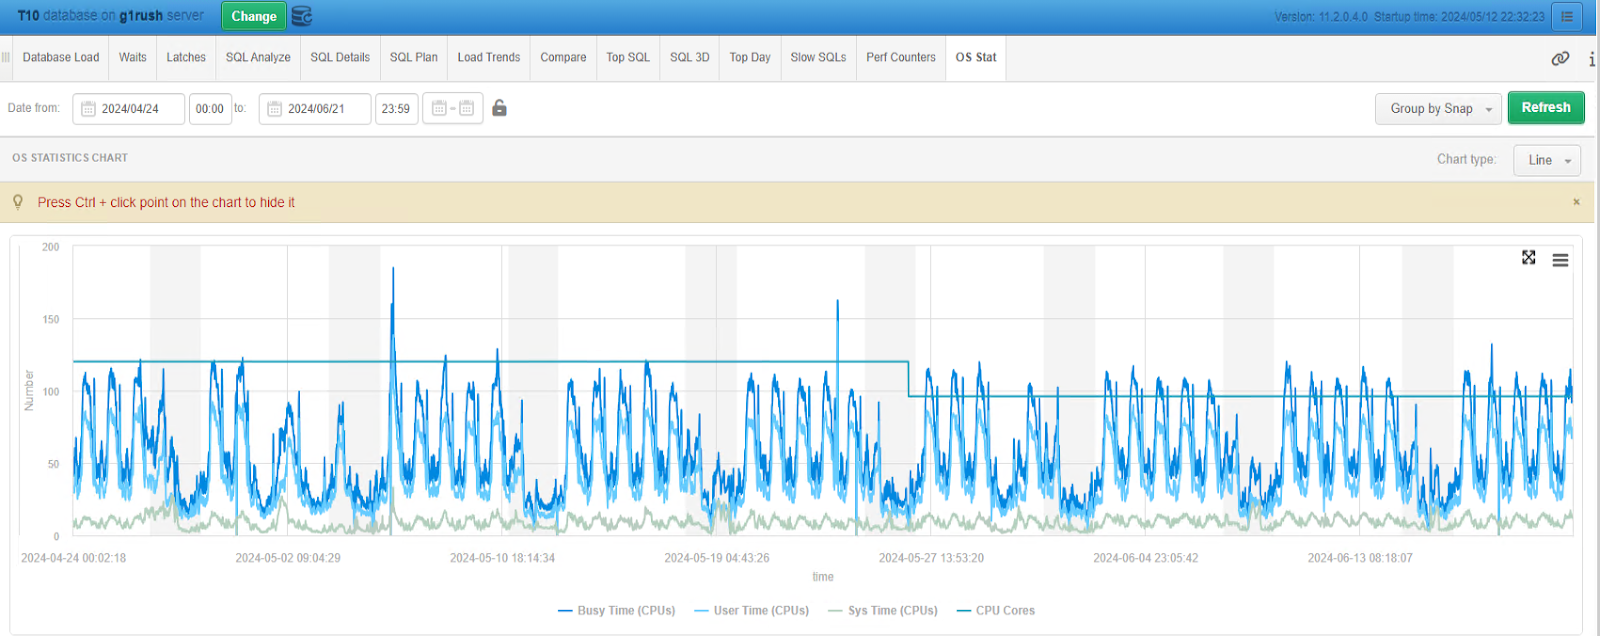
The above graph shows the busy time (CPUs), system time (CPUs), and user time (CPUs) with a clear pattern of cyclical peaks. This persistent high load required us to get deeper into the specific queries and processes consuming CPU resources.
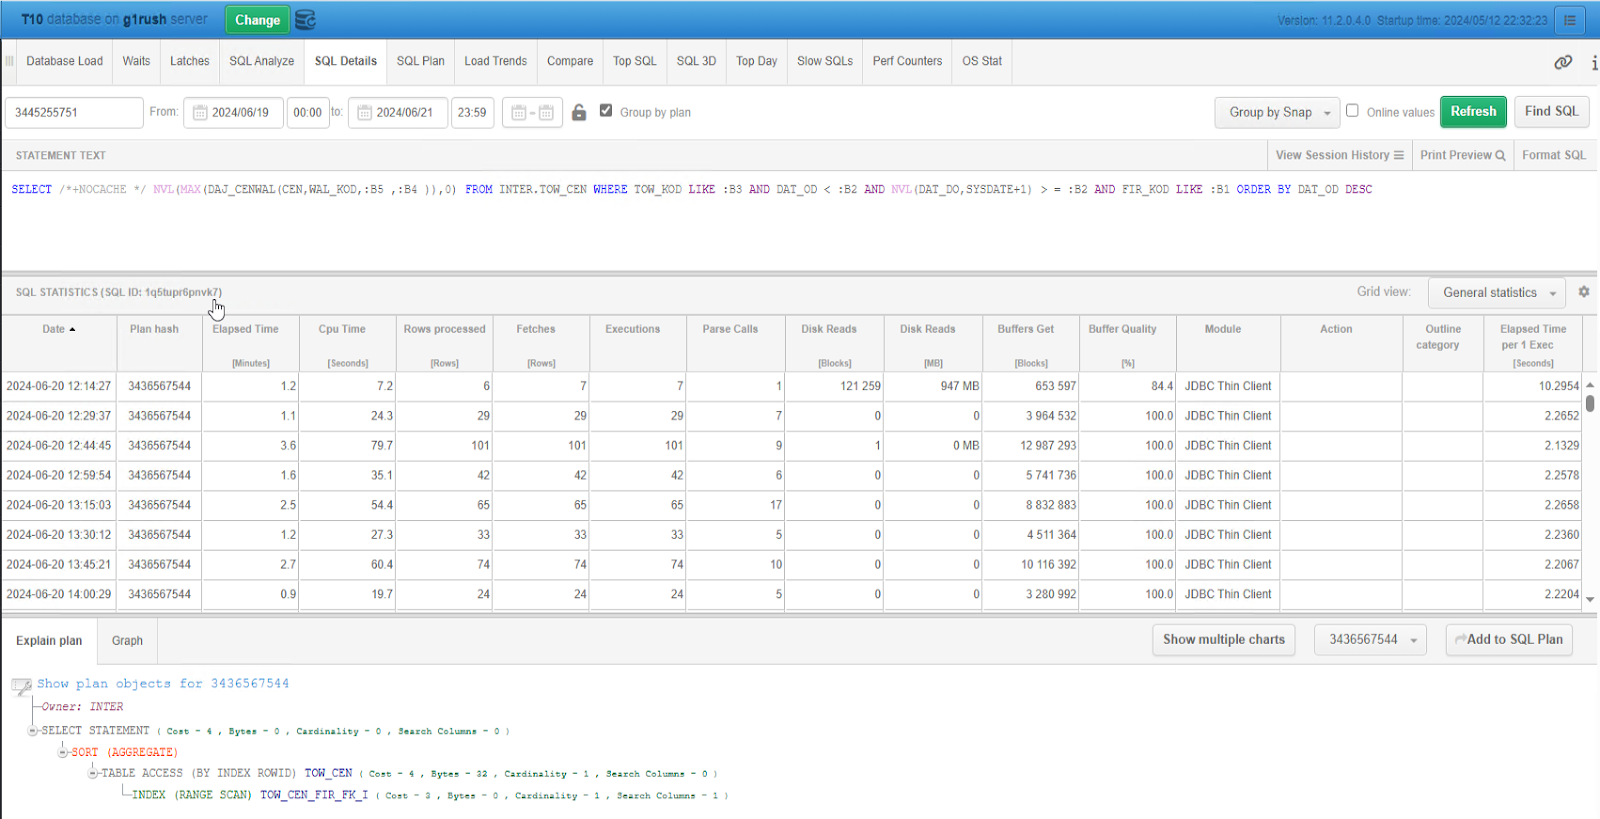
Detailed Query Analysis: Execution Time and Plan Changes
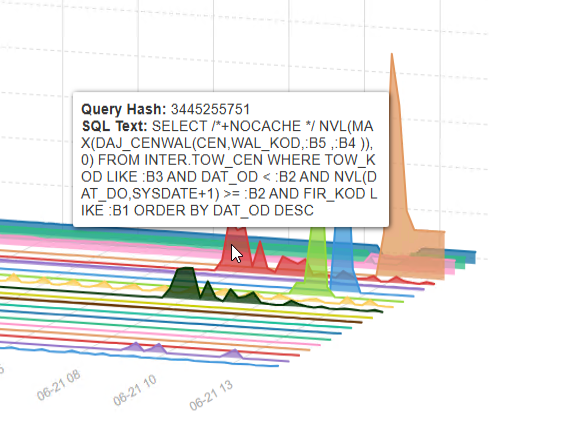
The next step was to analyze specific queries contributing to the high CPU load. Query ID 3445255751, in particular, showed significant changes in execution time and plan. These changes were suspected to be linked to extended execution times for another query, ID 904000402, due to shared function usage.
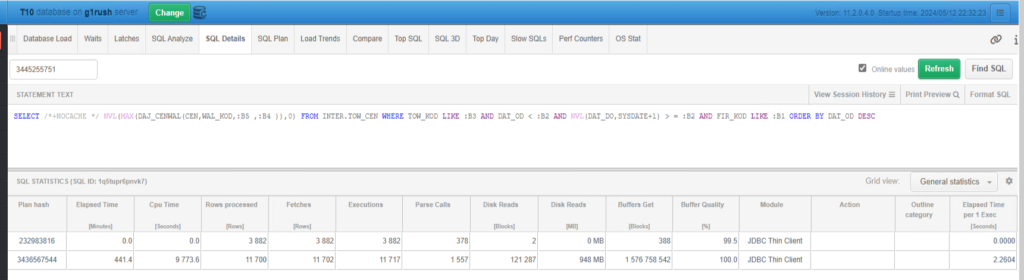
The analysis revealed that query 3445255751 had experienced fluctuations in execution time, impacting overall performance. By comparing execution plans, we identified plan hash 232983816 as a potential cause of inefficiency.
This comparison highlighted the need for stabilizing query performance by enforcing a specific plan. The shift in execution strategies suggested a need for consistent monitoring and timely adjustments. Additionally, these two queries seem to mirror each other, with their performance intricately linked.
Network Load
As we continued our investigation, we noted a significant network load, with data transfers reaching up to 52GB in an hour. This was indicative of substantial data movement, possibly exacerbating the performance issues observed.
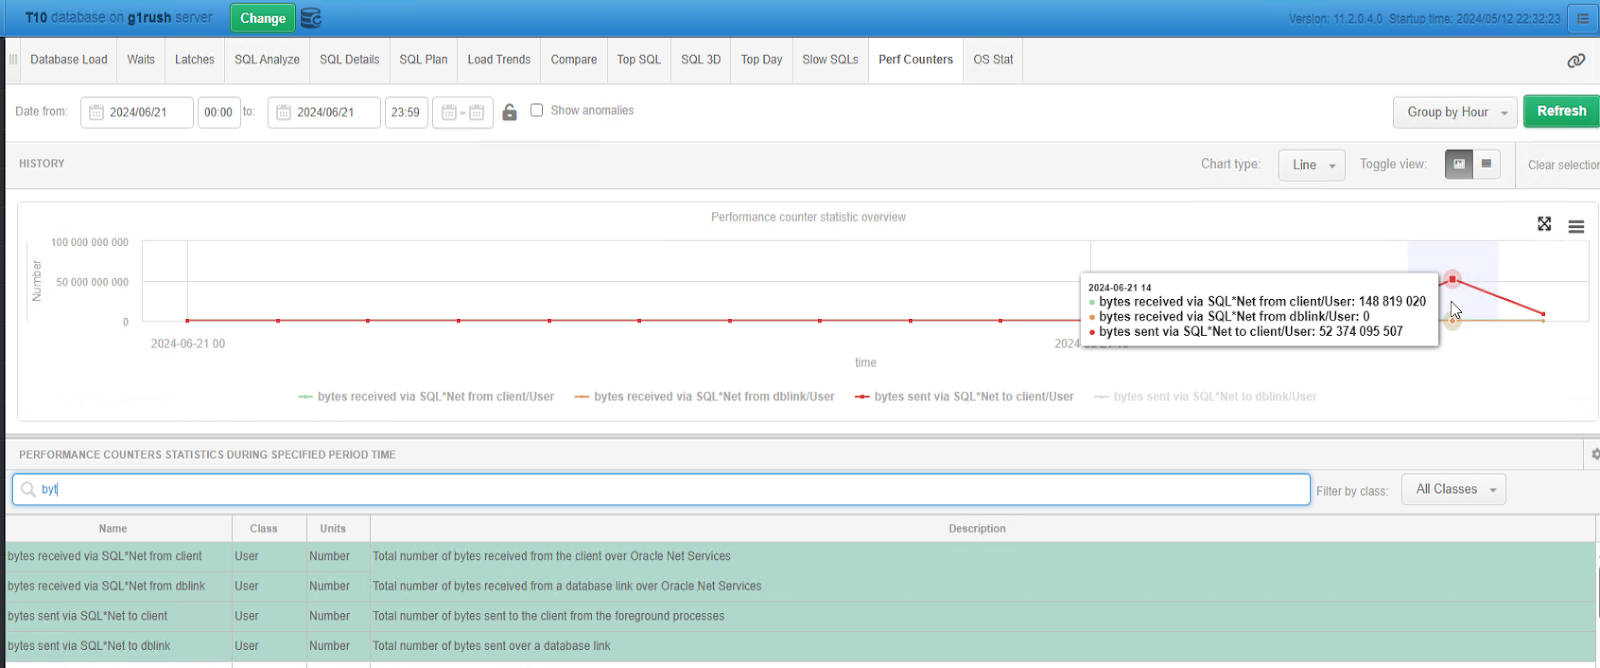
The network traffic analysis showed a high volume of bytes received and sent via SQL*Net, underscoring the impact of data transfer on overall performance. This added another layer to the interconnected issues we were facing.