Execution plans choose the way in which SQL queries are executed by the database engine. As such, they are a difference between a smoothly running database and one that stumbles under load. Sometimes, an execution plan changes, for various reasons—often silently and without warning—and the far-reaching fallout can be huge.
The most immediate impact seen as the execution plan changes is a decline in query performance. A query that once ran smoothly in milliseconds might, due to an altered plan, start consuming seconds. This increase in query time can cascade into longer load times for applications, frustrated end-users, and severe financial repercussions in high-stakes environments such as financial trading platforms or real-time data services.
Compounding the issue is the frequent oversight by application owners of these underlying shifts. Many remain largely focused on surface-level application performance. They assume that any slowdown or bottleneck is a software issue, deciding against digging into the database layer. This oversight is often a missed opportunity to catch and correct shifts that will later degrade application performance.
Where Standard Database Administration Tools Fall Short
Standard database administration tools popular today have a broad spectrum of system health metrics. What they don’t have, however, is the depth required to analyze and interpret execution plan changes effectively. These tools might alert administrators to spikes in CPU usage or slower query response times. However, they fail to offer more detailed insights necessary to pinpoint that these issues might stem from an execution plan change.
Further, while these tools can show when and where performance metrics falter, they rarely provide the historical data analysis necessary to track execution plan performance over time. Understanding trends in execution plan efficiency requires a longitudinal view—something that many out-of-the-box tools do not support. Without this capability, it’s challenging to identify whether a performance issue is a one-off anomaly or part of a longer-term decline in database efficiency.
Step-by-Step Analysis Using DBPLUS Performance Monitor
1. Starting the Analysis
This initial interface allows us to assess how queries interact with the database instance and how they impact overall system performance. Here, users can view a comprehensive breakdown of instance usage, which includes CPU consumption, I/O operations, and more, all displayed through intuitive graphs and charts.
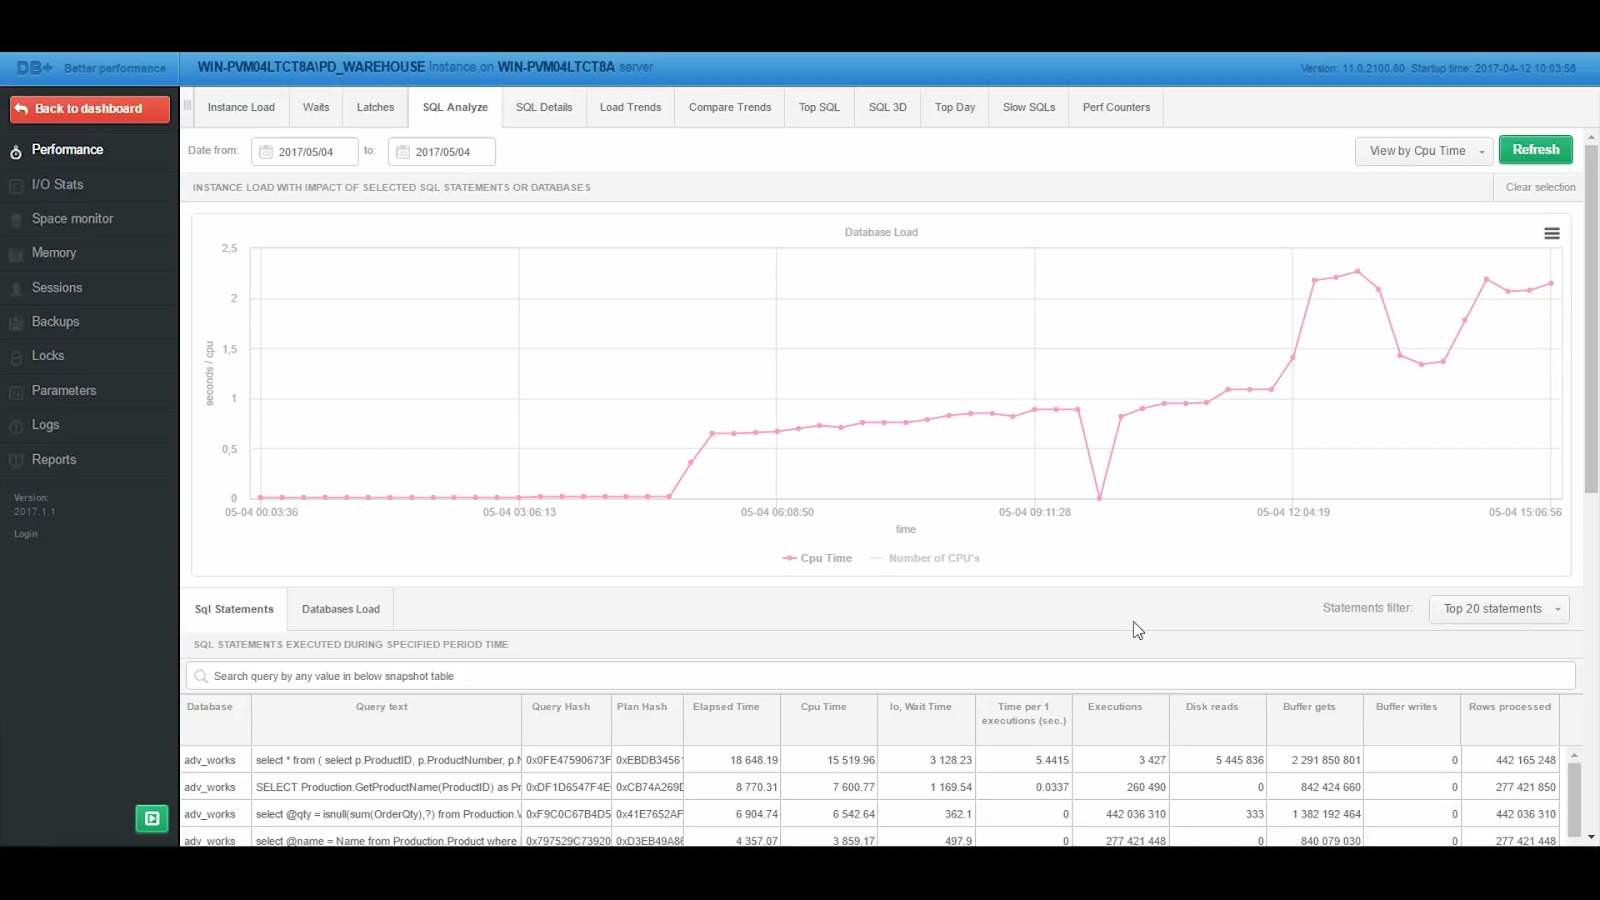
In this case, we analyze the database statistics from the last four days. The SQL Analyzer screen shows which queries were executed during that period but it’s not limited to that. It also highlights those that had the most significant impact on CPU usage.
By selecting the top queries from this list, we immediately see which operations are consuming the most resources and when spikes in usage occurred.
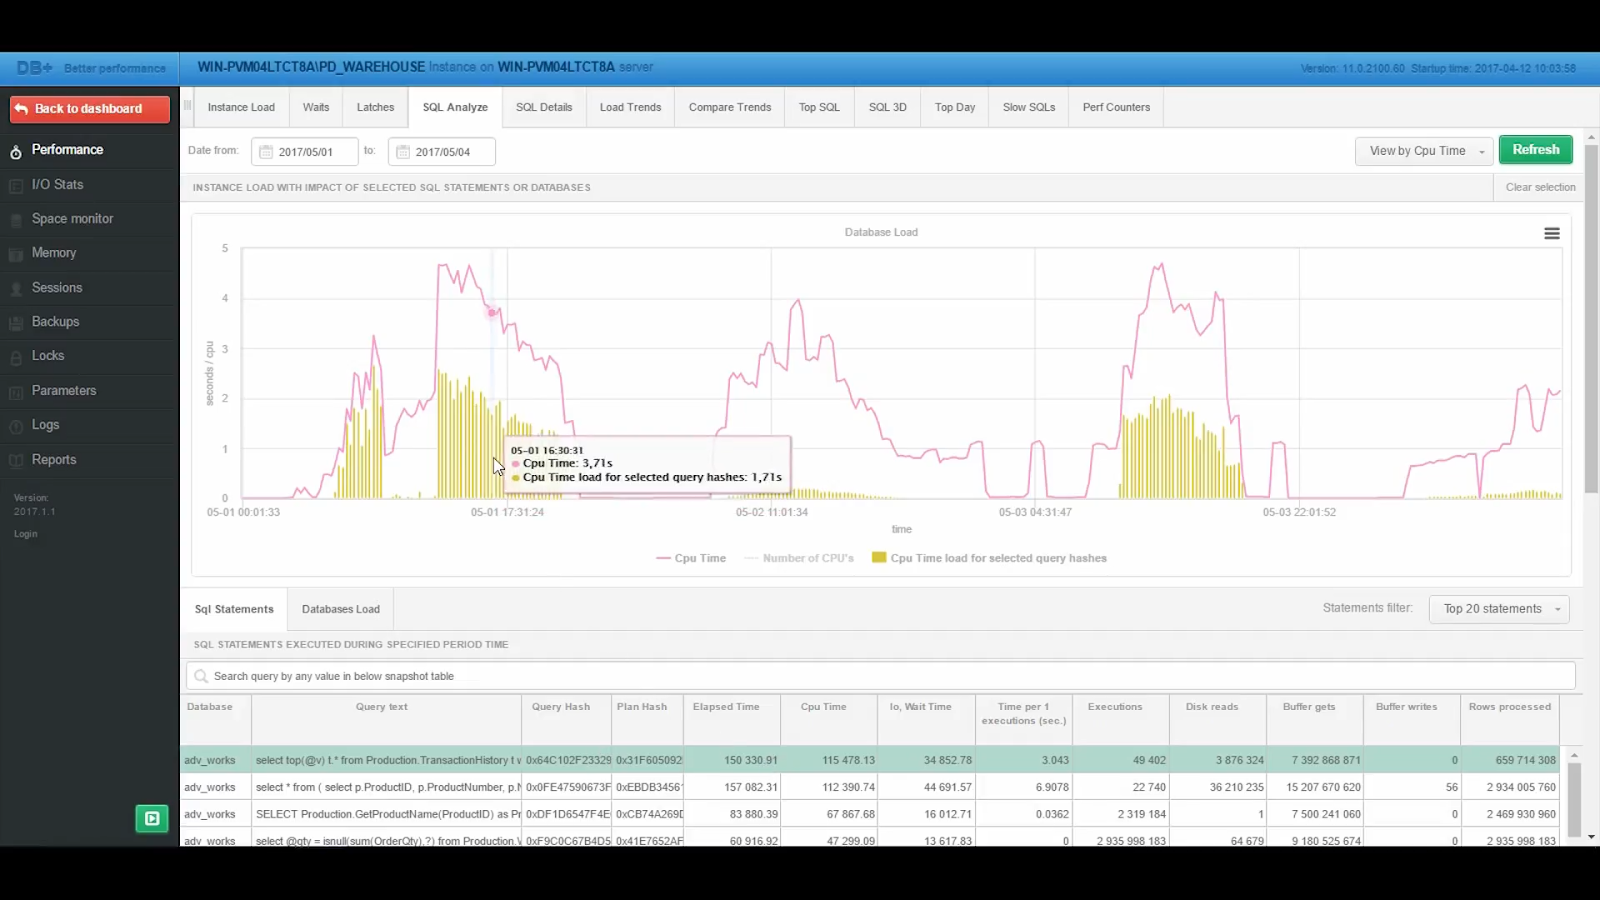
We can see that on some days, this specific query is responsible for 50% of the instance load. Why?

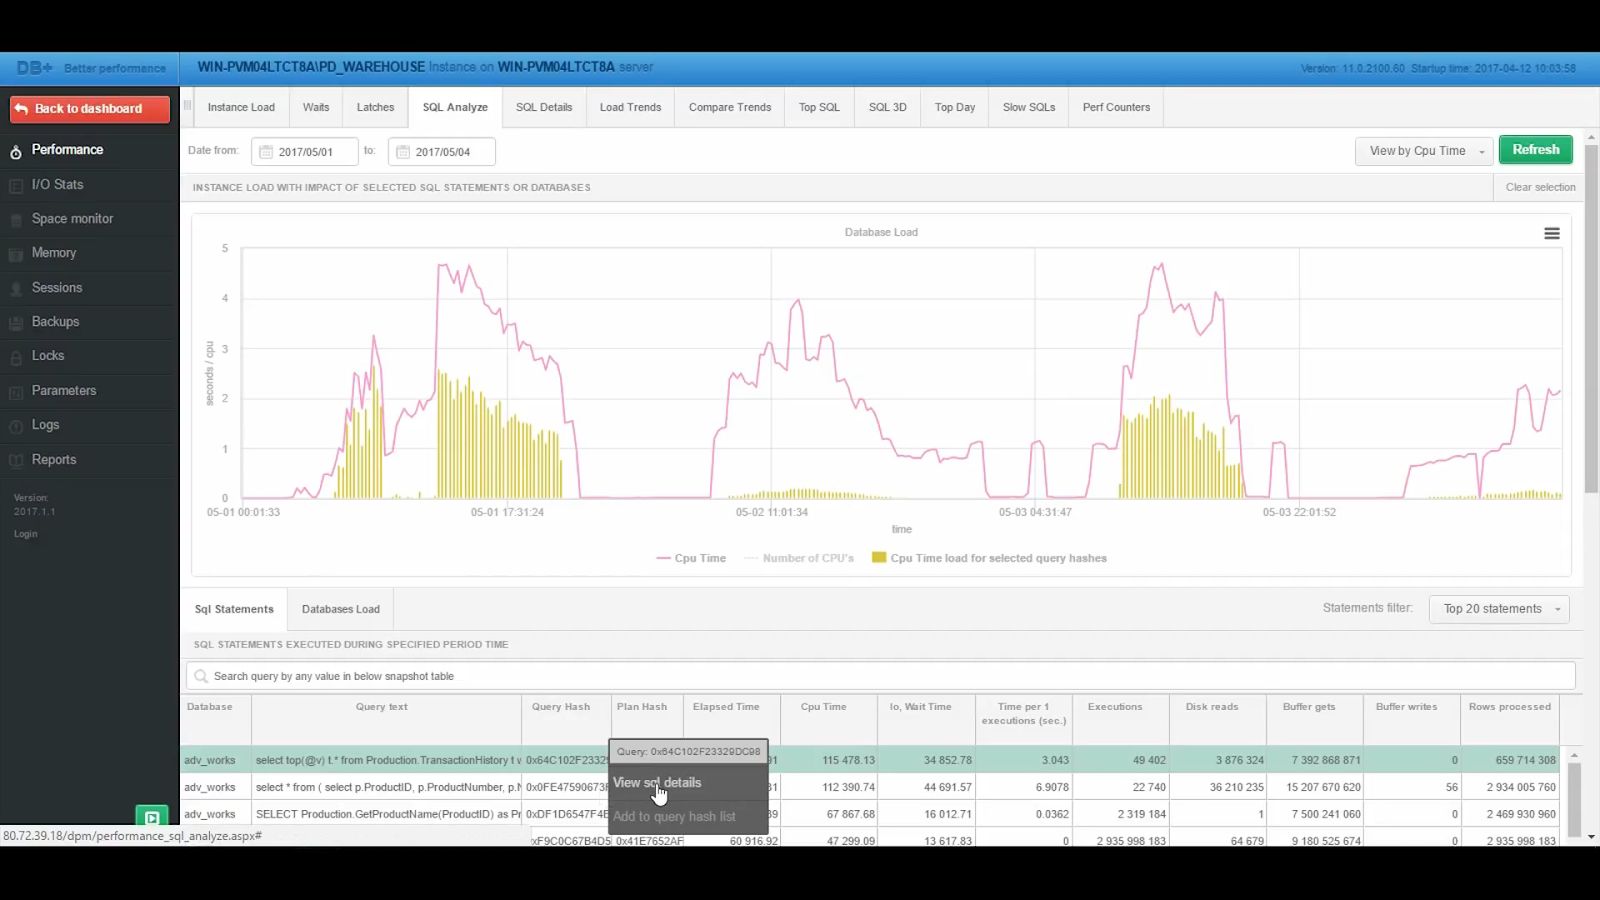
2. Detailed Query Analysis
After identifying the queries of interest from the SQL Analyzer screen, the next step is to get deeper into each specific query on the SQL Detail screen.
On the SQL Detail screen, statistics can be grouped by various intervals—days, weeks, or even months—giving administrators the flexibility to assess performance according to the needs of their analysis. In this case, grouping by day for the last four days reveals that a query performed well on two out of four days but on the others experienced a significant slowdown.
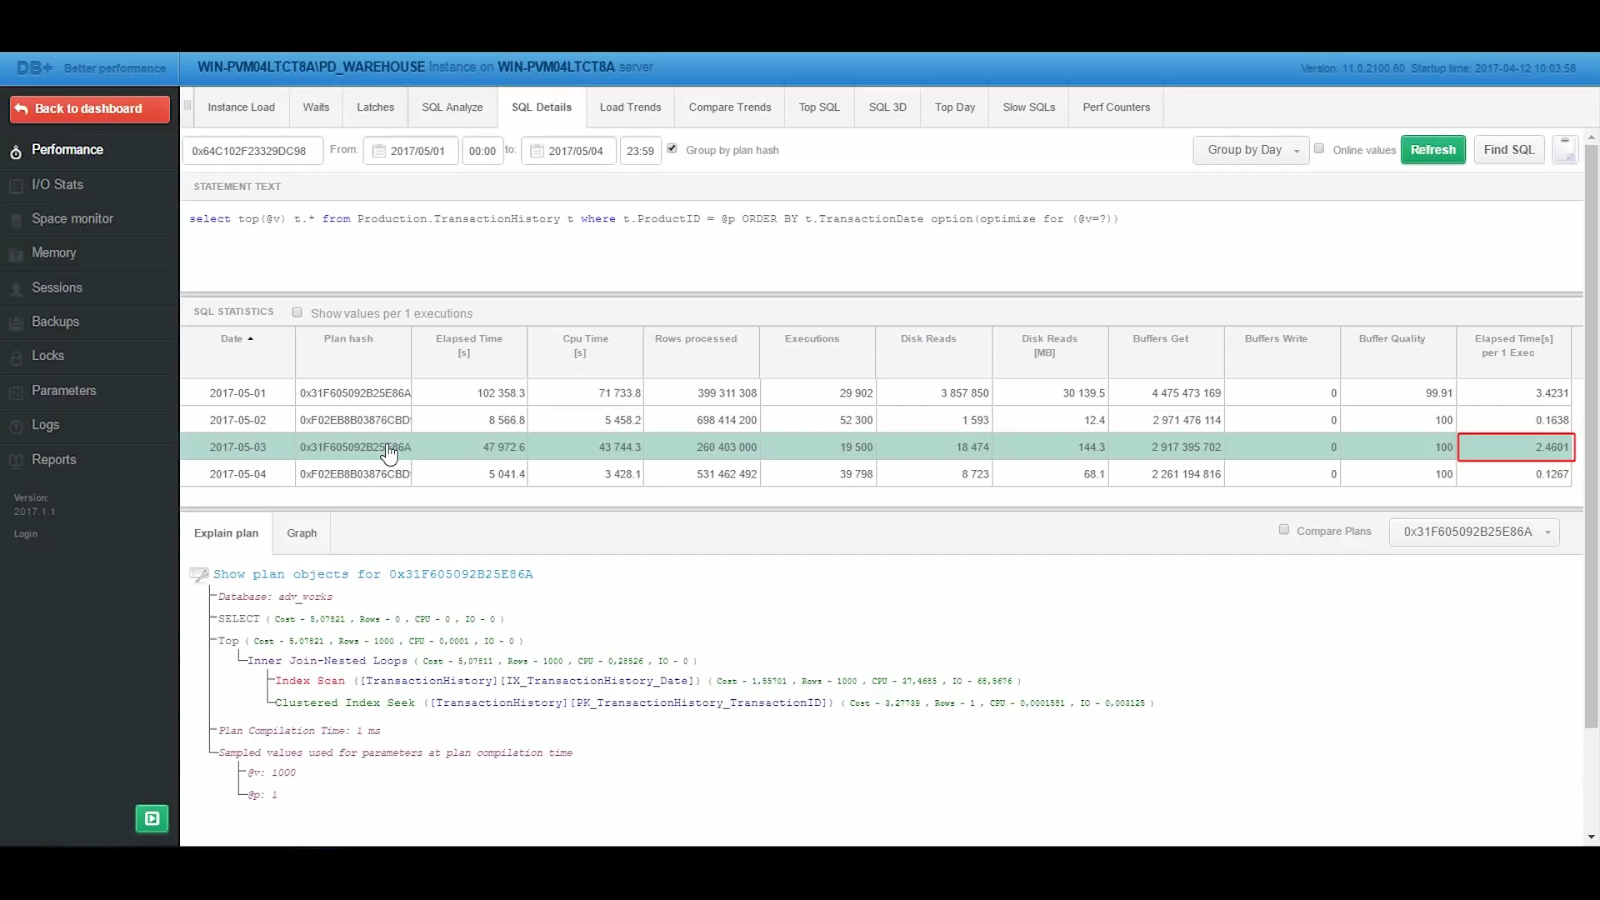
Such trends suggest fluctuations in database load or adjustments in execution plans that need further investigation
3. Identifying Inefficiencies in Execution Plans
At this stage, the focus shifts to identifying the root causes behind the performance variations observed. DBPLUS Performance Monitor enables the comparison of different execution plans for the same query, illustrating how each plan affects performance metrics such as execution time and resource usage.

We can now see that on days when the query executes more efficiently (left), the execution plan utilizes an index seek operation. It is typically used when the query optimizer decides it can locate the data more directly and efficiently. For this reason, it’s faster, because it locates and retrieves the necessary data without unnecessary overhead.
On days marked by reduced performance (right), the execution plan resorts to an index scan operation, which is less efficient due to the broader data sweep required.
4. Execution Plan Comparison
A visual comparison of two execution plans—one that leads to faster execution and another that results in slower performance—provides clear insights. The monitor allows users to view these plans side by side, analyzing differences in database optimizer strategies.
In this case, the slower execution plan involves the MS SQL Server optimizer choosing to read the entire index. All because of an ORDER BY clause that does not match the index used. The optimizer decides that scanning the entire index is necessary because the data needs to be sorted in a way that the existing index doesn’t support. This approach is less efficient because it involves reading more data than necessary. It’s also a reason why the slower query wasn’t in a hurry.
We can now get on our way to encourage the optimizer to select the more efficient path.